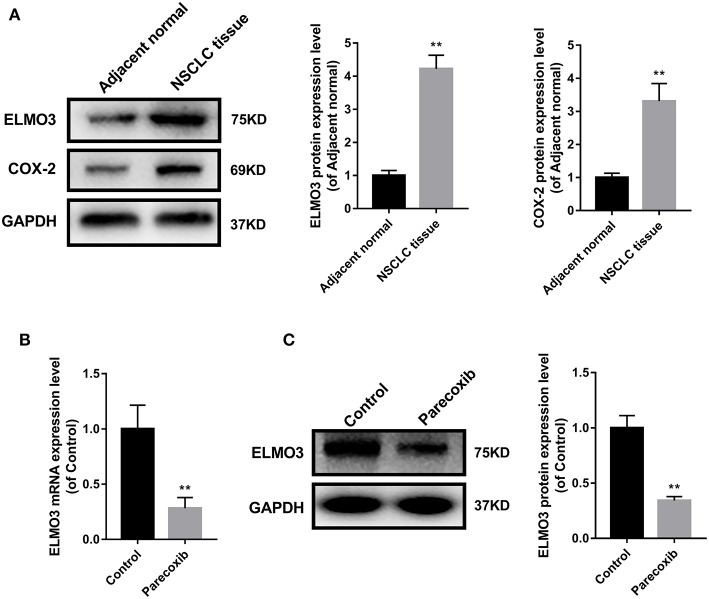
Figure 3.
Parecoxib inhibit ELMO3 expression in LLC cells. (A) ELMO3 and COX2 expression in human tissue samples. The protein levels of ELMO3 and COX2 were detected by western blot. *P < 0.05, **P < 0.01, vs. Adjacent normal. (B) The effects of Parecoxib on mRNA expression levels of ELMO3 in LLC cells. GAPDH was used as a loading control. The mRNA level of ELMO3 was detected by RT-PCR. **P < 0.01 vs. the control group. (C) The effects of Parecoxib on the expression of ELMO3 in LLC cells. The protein level of ELMO3 was detected by western blot. **P < 0.01 vs. the control group.

