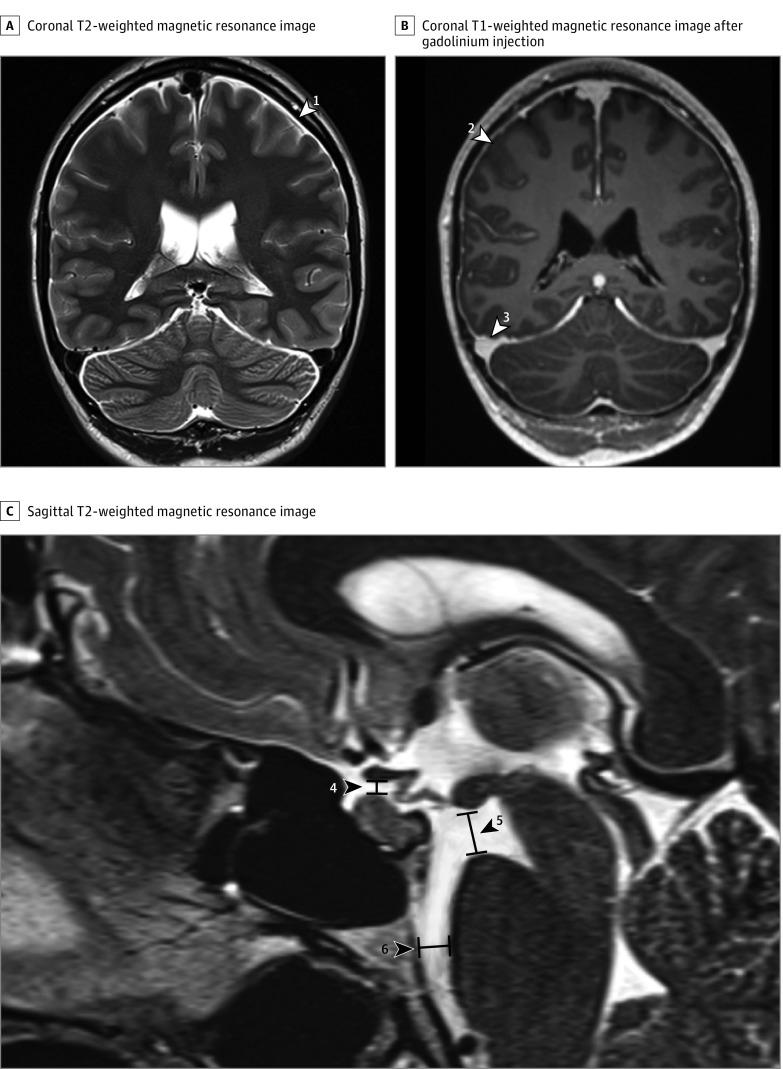
Figure 2. Imaging Findings Included in the Final Diagnostic Score.
A, Coronal T2-weighted magnetic resonance imaging (MRI) with subdural effusion (white arrowhead 1). B, Coronal T1-weighted MRI after gadolinium injection of the same patient, with dural enhancement (white arrowhead 2) and venous engorgement (white arrowhead 3). C, Sagittal T2-weighted MRI with effaced suprasellar cistern (black arrowhead 4; pathologic ≤4 mm), decreased mamillopontine distance (black arrowhead 5; pathologic ≤6.5 mm), and effaced prepontine cistern (black arrowhead 6; pathologic ≤5 mm).

