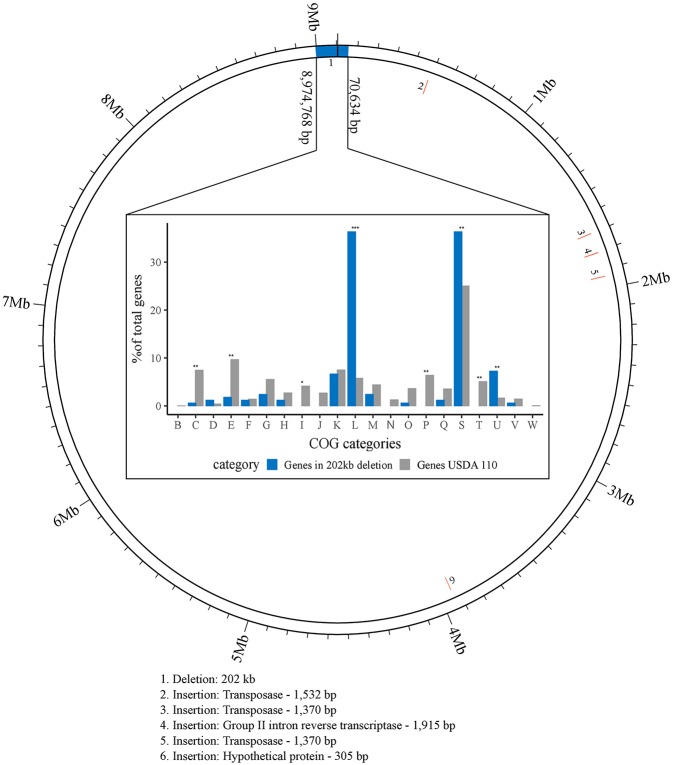
Figure 1.
Visualization of larger genomic changes in B. diazoefficiens strain 110spc4 (inner ring) compared to the USDA 110 NCBI reference genome (outer ring). Five insertions (2 through 6; red) and a large deletion region (1; blue) are shown (see Table 1). The bar chart shows the results of a Fisher's exact test for enrichment of COG categories annotated in 142 of 223 genes located in the 202 kb region of USDA 110 that is absent in strain 110spc4. Significant p-values are highlighted above each category (*p-value < 0.01; **p-value < 0.001; ***p-value < 0.00001). The percentages of genes (count of genes / total no. of genes) for each COG category (X-axis) from USDA 110 (gray) or from the 202 kb deletion region (blue) are shown on the Y-axis.

