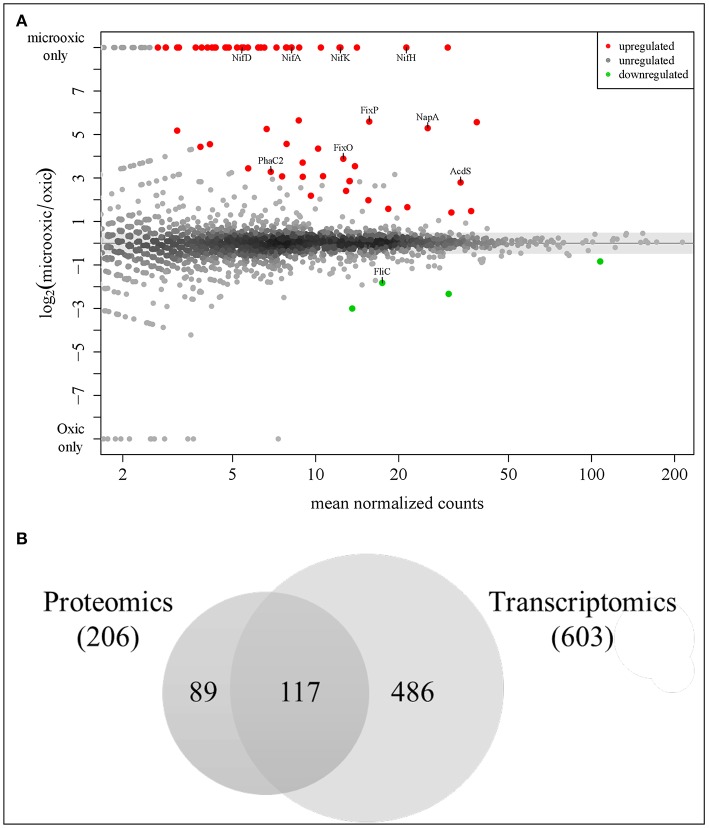
Figure 4.
Analysis of differential protein and gene expression in microoxia. (A) MA plot visualizing the differential protein expression data. Sixty-two proteins most significantly up-regulated in microoxia are shown in red, those most significantly down-regulated (four proteins) in green. The names of selected proteins are indicated. (B) Overlap of proteins upregulated in microoxic conditions with previous transcriptomics data (Pessi et al., 2007). Using a less stringent threshold (log2 FC ≥ 1) identical to that used in a prior transcriptome analysis, 206 proteins fulfilled the criterion, including the top 62 up-regulated proteins (p-value ≤ 0.2) shown in (A). The overlap with 603 protein-coding genes among the 620 genes previously found to be induced at the transcript level (Pessi et al., 2007) is shown here: 117 genes/proteins are upregulated both at transcript and protein level (see Table 2).

