
Figure 4:
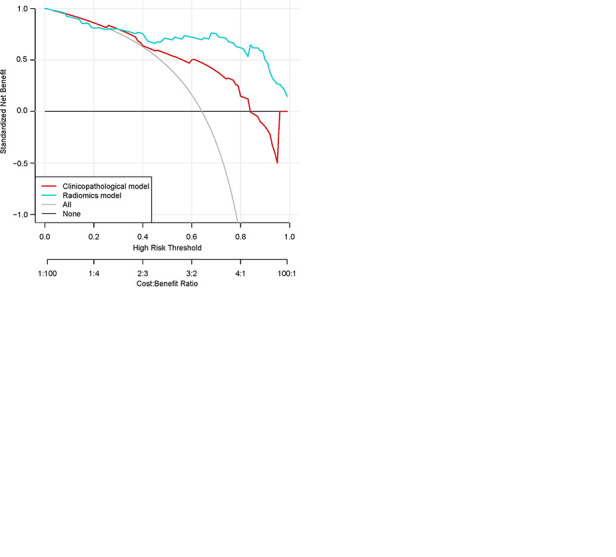
Kaplan-Meier survival analyses according to the radiomics signature risk-score for patients in, A, the training dataset and, B, the test set. A significant association of the radiomics signature with the time-to-progression (TTP) rate was shown in the training dataset (P < .0001), which was then confirmed in the validation dataset (P < .0001). C, Decision curve analysis for each model. The radiomics model had the highest net benefit in predicting which high-risk patients should receive treatment, as compared with a clinicopathologic model and simple strategies such as follow-up of all patients or no patients. This analysis was performed across the full range of threshold probabilities at which a patient would be selected to undergo follow-up imaging.