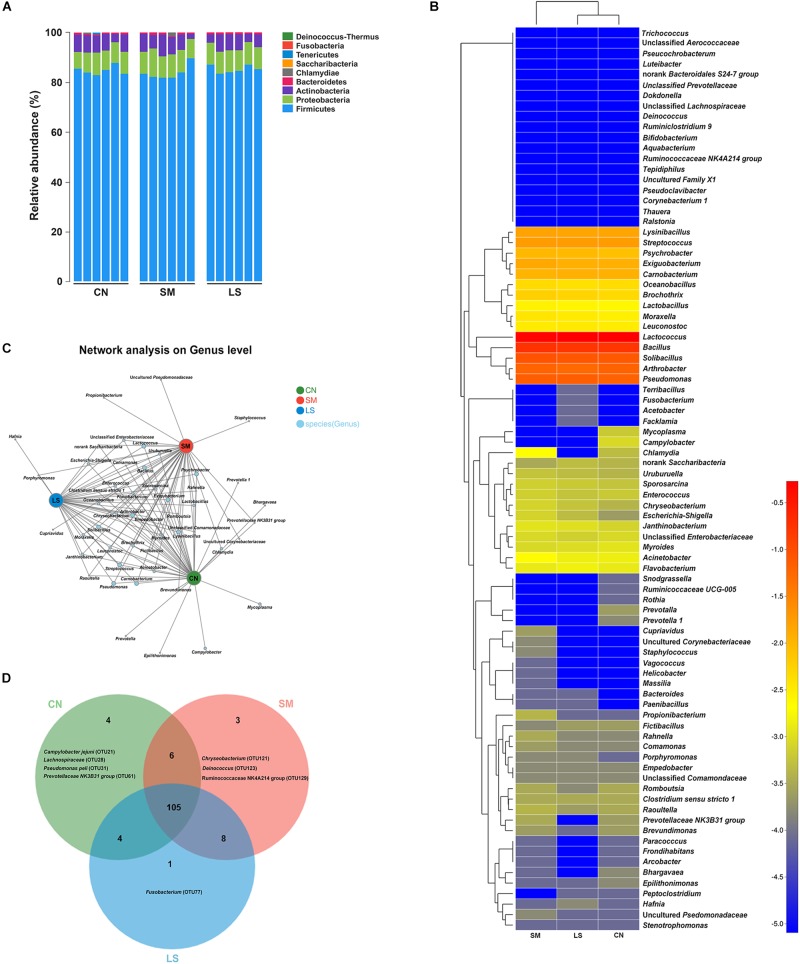
FIGURE 1.
Ileal mucosal microbiota communities of newly weaned pigs in response to S. 4,[5],12:i:- challenge and LGG pretreatment. (A) Ileal mucosal microbiota communities at the phylum level. The stacked bars show the combined relative abundance of phylum-level taxa per animal. Colors are assigned for all phyla detected. (B) Heatmap showing the spatial distributionsof all OTUs at the genus level, indicating the relative abundance of genera per animal (n = 6 per group) that received oral sterile physiological saline (CN), oral sterile physiological saline followed by S. 4,[5],12:i:- (1 × 10¹⁰ CFU/ml, 10 ml) challenge (SM), or LGG (1 × 10⁹ CFU/ml, 10 ml/day) for 1 week followed by S. 4,[5],12:i:- (LS). Genera are clustered to the left based on relative abundance. The relative abundance of each genus is indicated by a color gradient from blue (low abundance) to red (high abundance). (C) A network diagram showing the OTUs among the three groups. (D) Venn diagrams displaying the overlap degree of OTUs in the ileal mucosal microbiota of the three groups.

