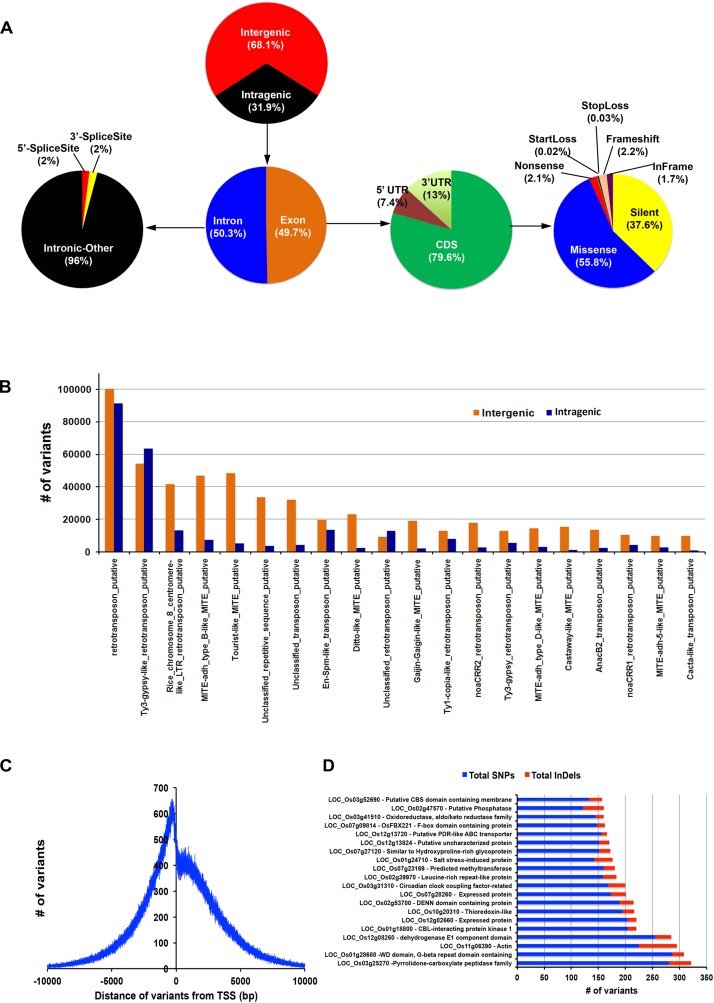
FIGURE 3.
Comprehensive variant detection and annotation. Panel (A) indicates the distribution of variants in different regions of genome. Panel (B) represents the number of variant in different types of repeats. (C) Variant density graph from transcription start site (TSS). (D) Genes containing highest SNPs/INDELs variations.

