
FIGURE 1.
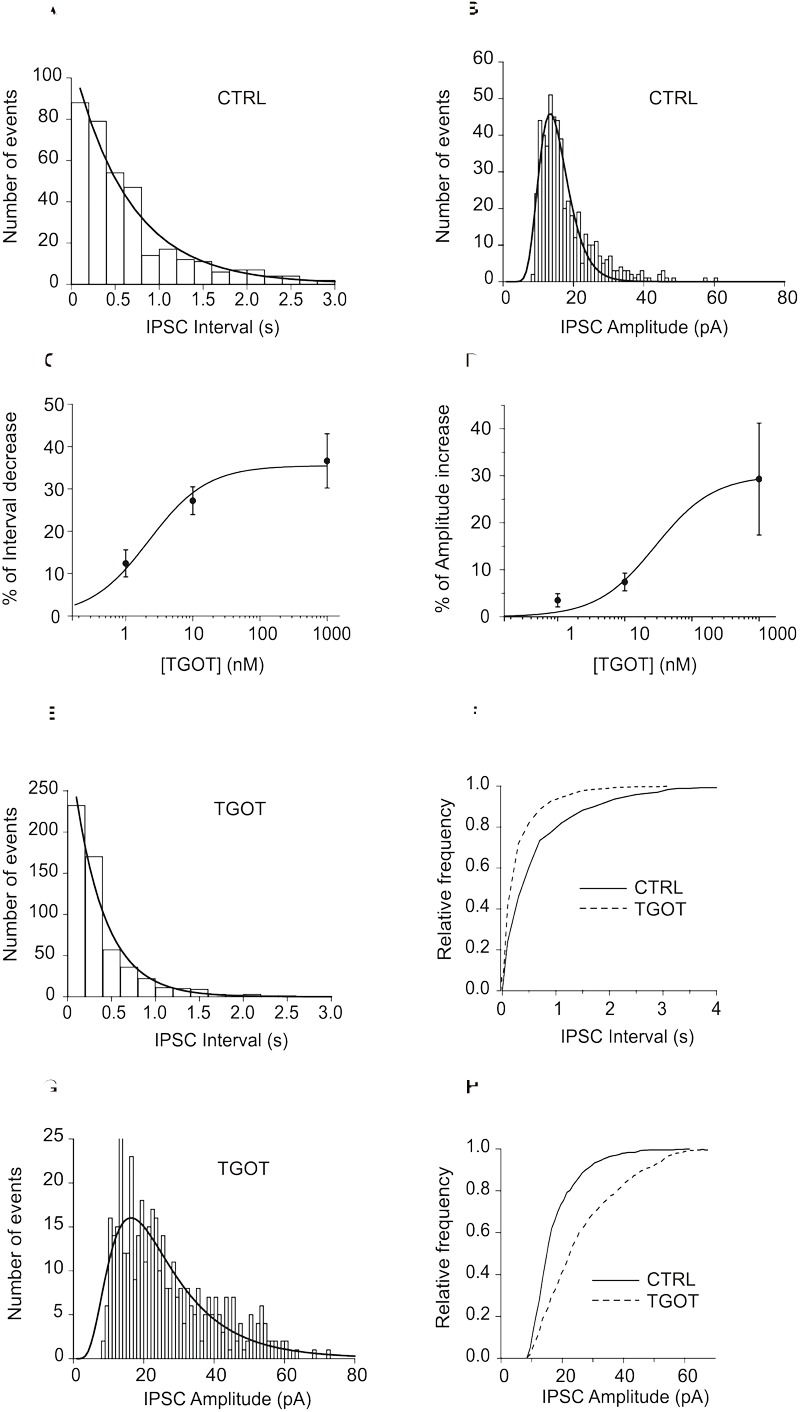
(A) Representative exponential distributions of the intervals of spontaneous synaptic currents under control conditions from a PYR Otr+/+ cell. In control saline (A), the mean inter-event interval, obtained by interpolation of the interval distribution with a single exponential function, was 646 ± 49 ms (365 events). (B) Representative lognormal distributions of the amplitudes of spontaneous synaptic currents under control conditions from a PYR Otr+/+ cell. The mean log-normally distributed sIPSC amplitude was 14.7 ± 0.2 pA. (C) Mean dose-response relationship between the percentage of sIPSC inter-event interval decrease and TGOT concentration (N = 13 for 1 and 10 nM; N = 23 for 1 μM). (D) Mean dose–response relationship between the percentage of sIPSC amplitude increase and TGOT concentration (N = 15 for 1 nM, N = 18 for 10 nM and N = 23 for 1 μM). (E) In the presence of TGOT the mean inter-event interval was 351 ± 34 ms (559 events), the two interval distributions (A vs. E) being significantly different. (F) Cumulative distributions of the normalized frequencies vs. sIPSC intervals under control conditions (continuous line) and in the presence of 1 μM TGOT (dashed line) from the same PYR Otr+/+ cell as in (A–E). (G) The mean log-normally distributed sIPSC amplitude increased to 22.4 ± 0.9 pA in the presence of TGOT. (H) Cumulative distributions of the normalized frequencies vs. sIPSC amplitude under control conditions (continuous line) and in the presence of 1 μM TGOT (dashed line) from the same PYR Otr+/+ cell as in (B–G). In (C,D) vertical bars denote SE from the mean.