
FIGURE 2.
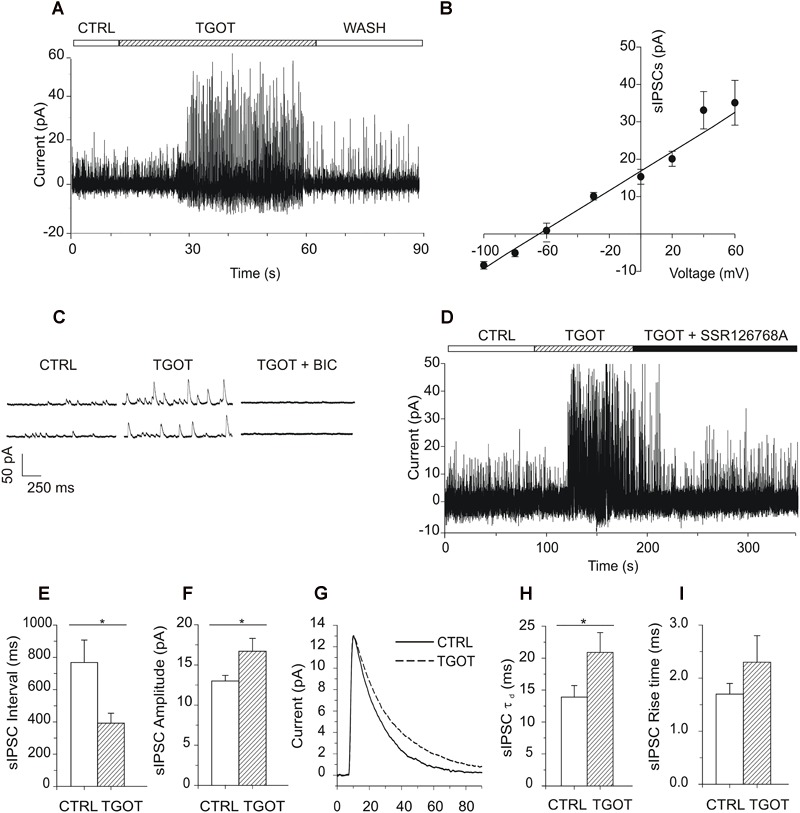
Effects of TGOT on sIPSCs in PYRs from Otr+/+ mice. (A) Sample current trace showing sIPSCs recorded during slice perfusion with control saline (CTRL), in the presence of 1 μM TGOT (TGOT) and during wash out (WASH). The upper horizontal bar indicates the time course of drug delivery. (B) Mean current-to-voltage relationship of the sIPSC peak amplitudes (N = 5), showing a reversal potential close to –60 mV. The straight line represents data point fitting. (C) Representative current traces of sIPSCs recorded in the presence of glutamatergic synaptic blockers at a holding potential of 0 mV under control conditions (CTRL), in the presence of 1 μM TGOT (TGOT) and during the co-administration of TGOT with the selective GABAAR antagonist bicuculline (10 μM) (TGOT + BIC). (D) Representative current trace of sIPSCs recorded in the presence of glutamatergic synaptic blockers, at a holding potential of 0 mV, under control conditions (CTRL), during TGOT administration (TGOT) and during the co-administration of TGOT with the selective murine OtR isoform antagonist SSR126768A (0.1 μM) (TGOT + SSR126768A). (E) Bar plots comparing the mean values of the sIPSC inter-event intervals (N = 23) obtained in control saline and during TGOT application (∗p < 0.05). (F) Bar plots comparing the mean values of the sIPSC amplitudes (N = 23) obtained in control saline and during TGOT application (∗p < 0.05). (G) Superimposed average traces of sIPSCs (lined up according to the mid-point of their rise times), recorded in the presence of glutamatergic synaptic blockers, at a holding potential of 0 mV, under control conditions (continuous line, averaging of 25 traces) and during TGOT application (dashed line, averaging of 168 traces whose amplitude was normalized to that of control). (H) Bar plots comparing the mean values (N = 4) of the sIPSC time constant of decay (τd) obtained under control conditions and during TGOT application (∗p < 0.05). (I) Bar plots comparing the mean values (N = 4) of the sIPSC rise time obtained under control conditions and during TGOT application. Vertical bars in (B,E,F,H,I) indicate SE from the mean.