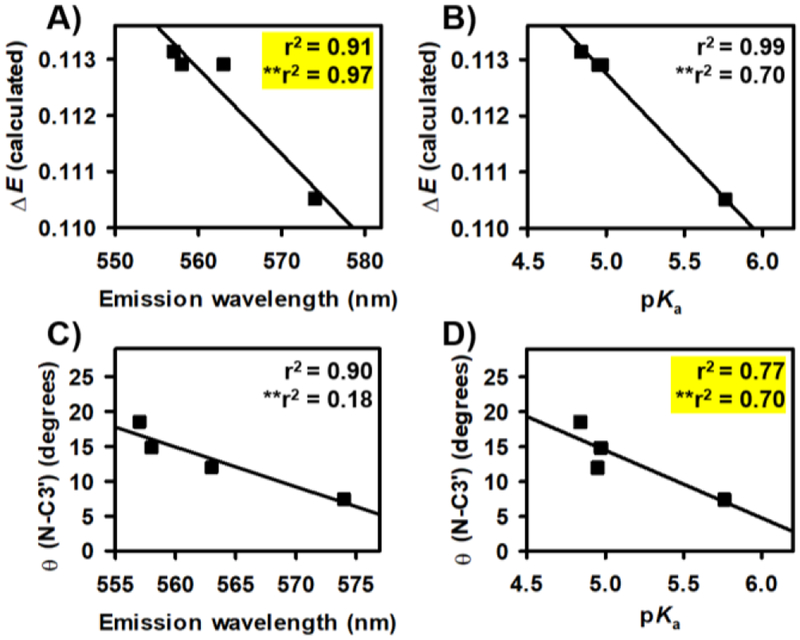
Figure 4.
Linear regression analyses and statistical measure between select set of parameters of the non-NIR fluorescent rosol dyes without and with inclusion of relevant values of THQ-Rosol. Correlation plots interrelating the calculated molecular orbital energy gap (ΔE) value to the A) maximum fluorescence emission wavelength (λem) and B) pKa value of the evaluated fluorescent rosol dyes. Correlation plots interrelating the modeled N-C3’ torsion angle to the C) maximum fluorescence emission wavelength (λem) and D) pKa value of the evaluated fluorescent rosol dyes. The r2 value is the accompanying coefficient of determination of the aforementioned analyzed set of parameters of the evaluated non- NIR fluorescent rosol dyes without and with (**) THQ-Rosol. Yellow highlights that the correlation was maintained between the set of parameters upon inclusion of the relevant values of THQ-Rosol.

