
Fig. 1. engineering VARNAM on high-throughput platform.
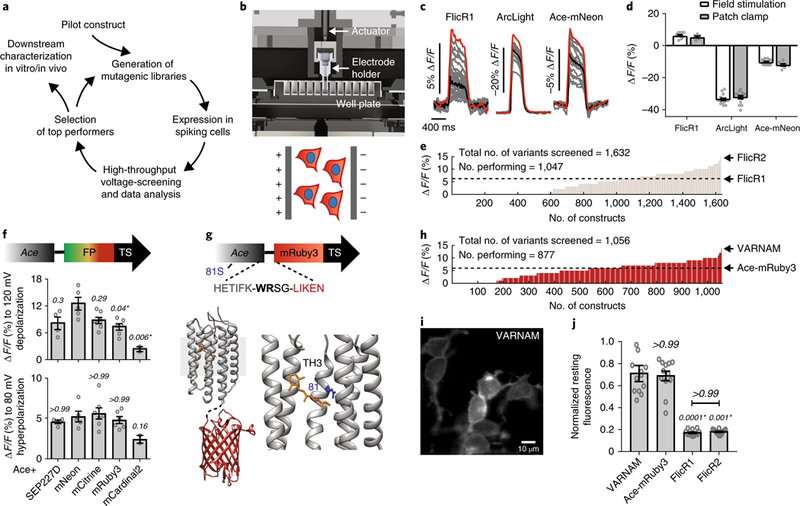
a, Voltage screening workflow. b, Top, computer-aided design of 96-well voltage-imaging platform. Bottom, cartoon of cells expressing red GEVI and blue nuclear marker under an electric field. c, Fluorescence responses (gray) from individual cells expressing FlicR1, ArcLight or Ace-mNeon (n = 24 wells/condition). Black and red traces represent mean and maximum responses, respectively. d, Comparisons of maximum fluorescence responses on the platform to mean response from patch-clamp recordings for FlicR1, ArcLight and Ace-mNeon. n = 10 and 6 cells, 15 cells each, and 16 and 7 cells, respectively. P > 0.99, P = 0.54 and P = 0.4 between the two groups (field stimulation vs. patch clamp recordings) in the three conditions, respectively (two-way ANOVA with Bonferroni’s multiple comparisons test). e, Distribution of voltage sensitivities of FlicR variants screened on the platform. f, Fluorescence responses to 120 mV depolarization and 80 mV hyperpolarization in HEK cells expressing Ace fusions with indicated FPs. n = 4 cells (Ace-SEP227D), 5 cells (Ace-mNeon), 7 cells (Ace-mCitrine), 6 cells (Ace-mRuby3), 2 cells (Ace-mCardinal2). Statistical comparisons were made to Ace-mNeon. P values are italicized. Asterisks denote statistical significance (Kruskal-Wallis test with Dunn’s multiple comparisons correction). g, Top, VARNAM schematic showing amino acid sequence at Ace-FP junction, and 81 S. Bottom, crystal structures of Ace (PDB 3AM6) and mRuby (PDB 3U0N) in fusion configuration. Lower right, magnified view of Ace with chromophore retinal (yellow) and residue 81 (blue). TH3, third transmembrane helix. h, Distribution of voltage sensitivities of screened Ace-mRuby3 variants. i, Epifluorescence image of HEK cells expressing VARNAM (n = 24 wells, 6 cultures). j, Resting fluorescence of VARNAM, Ace-mRuby3, FlicR1 and FlicR2 in HEK cells normalized to average resting intensity of Ace-mNeon. P values are italicized. Statistical comparisons were made to VARNAM. Asterisks denote significance (Kruskal−Wallis test with Dunn’s multiple comparisons correction), n = 12 wells/condition, ~500 cells/well. In d,f,j, values represent mean ± s.e.m.