
Fig. 3. VARNAM resolves fast APs and postsynaptic potentials in acute slices.
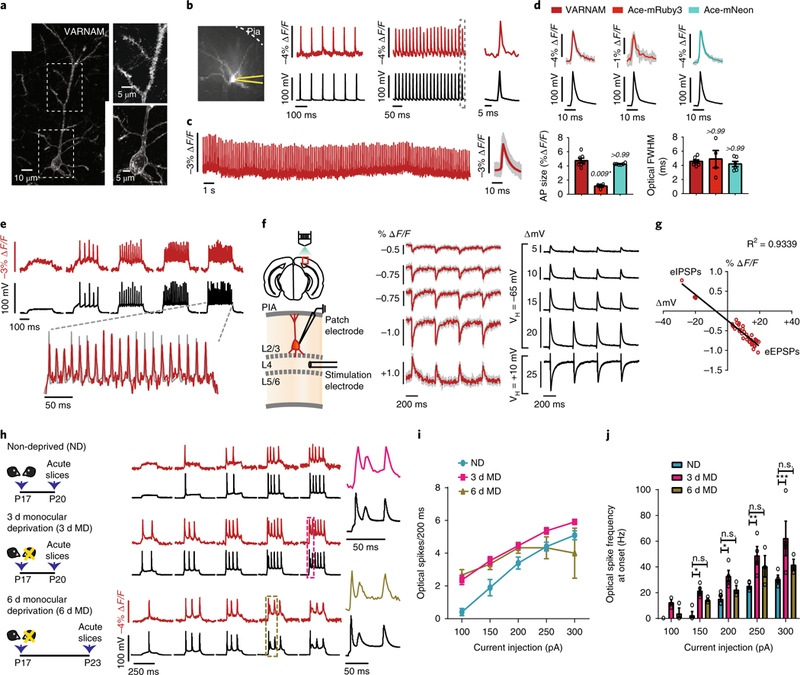
a, Left, confocal image of VARNAM-electroporated pyramidal neuron in fixed slice (n = 27 neurons). Right, magnified views of soma and apical dendrite. b, Left, 80 × 80 pixel image of VARNAM-expressing neuron in acute slice. Recording pipette is in yellow. Right, single-trial optical (red) and electrical (black) APs elicited by 10 and 50 Hz current injections. Dotted box denotes response expanded to the right. c, Left, optical recordings during 30 s spontaneous activity. Right, mean optical waveform (red) (n = 131 spikes). Shading denotes all spikes combined. d, Top, mean optical and electrical AP waveforms from VARNAM (left), Ace-mRuby3 (center) and Ace-mNeon-recordings (right). Shading denotes all spikes combined. Bottom, mean amplitude (left) and FWHM (right) of waveforms shown above. n = 7, 4 and 6 neurons from 4, 3 and 3 mice, respectively. P values are italicized. Statistical comparisons were made to VARNAM. Asterisk denotes significance (Kruskal−Wallis test with Dunn’s correction). e, Fluorescence responses to increasing amplitudes of current injections (starting at 200 pA, 5 cycles, ∆50 pA). Dashed lines correspond to trial shown at an expanded timescale. f, Left, Schematic of ePSP measurements. Right, Optical and electrical recordings of eEPSPs and eIPSPs. Optical traces are 10 trial averages. Shading denotes s.e.m. VH, holding potential; ∆mV, PSP amplitude; L, layer. g, Peak fluorescence responses plotted against PSP amplitude. Red dots represent individual peaks that exhibit a linear fit (n = 36 PSPs, 6 neurons). h, Left, Monocular deprivation protocol; right, fluorescence responses to current injection steps. Color-coded boxes enclose responses expanded to the right. i,j, Optical spike rate (i) and spike frequency at onset (j) as a function of current injection amplitude (n = 4 neurons per condition). *P < 0.05, **P < 0.005, ***P < 0.001; n.s., not significant (two-way ANOVA with Bonferroni’s test). Values in d,i,j, represent mean ± s.e.m.