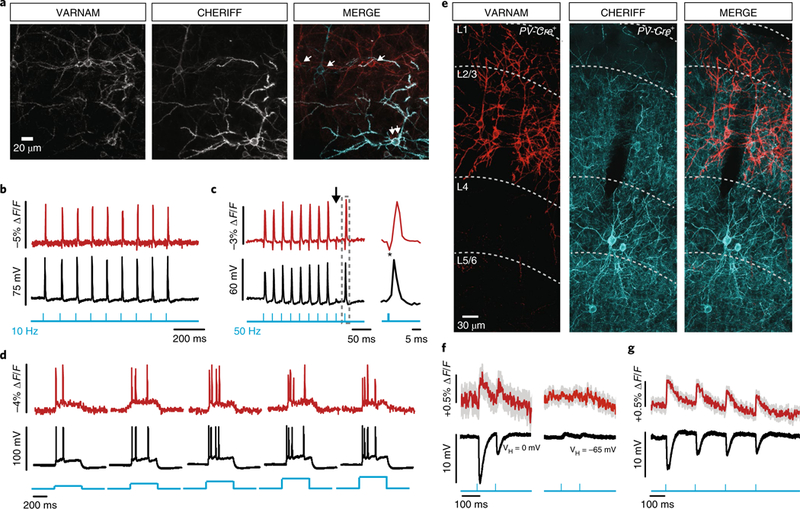
Fig. 4. All-optical electrophysiology in acute slices.

a, Confocal images of a slice co-electroporated with CheRiff and VARNAM (n = 5 fields of view). Single and double arrows in the merged image indicate neurons expressing one or both constructs, respectively. b,c, Optical and electrical spikes induced by 10 Hz (b) and 50 Hz (c) blue-light pulses (vertical blue lines) (0.5 ms, 0.5–1 mW mm−2). Arrow in c indicates spike failure. Gray box indicates interval shown at an expanded time scale. *Blue-light artifact (1 mW mm−2). d, Fluorescence responses to 400 ms blue-light illumination (blue steps) at increasing intensities (0.4–2.4 mW mm−2). e, Confocal images of a fixed slice from PV-Cre+ mouse showing cell-type-specific VARNAM and CheRiff expression (n = 7 fields-of-view). f,g, Mean optical and electrical IPSPs evoked by (f) blue-light pulses (2.5 mW mm−2) at depolarized (left) and resting potentials (right) and (g) longer trains of pulses at depolarized potentials. n = 15 trials, each. Shading denotes s.e.m.
