
Fig. 5. VARNAM reveals brain-state-dependent voltage dynamics in freely behaving mice.
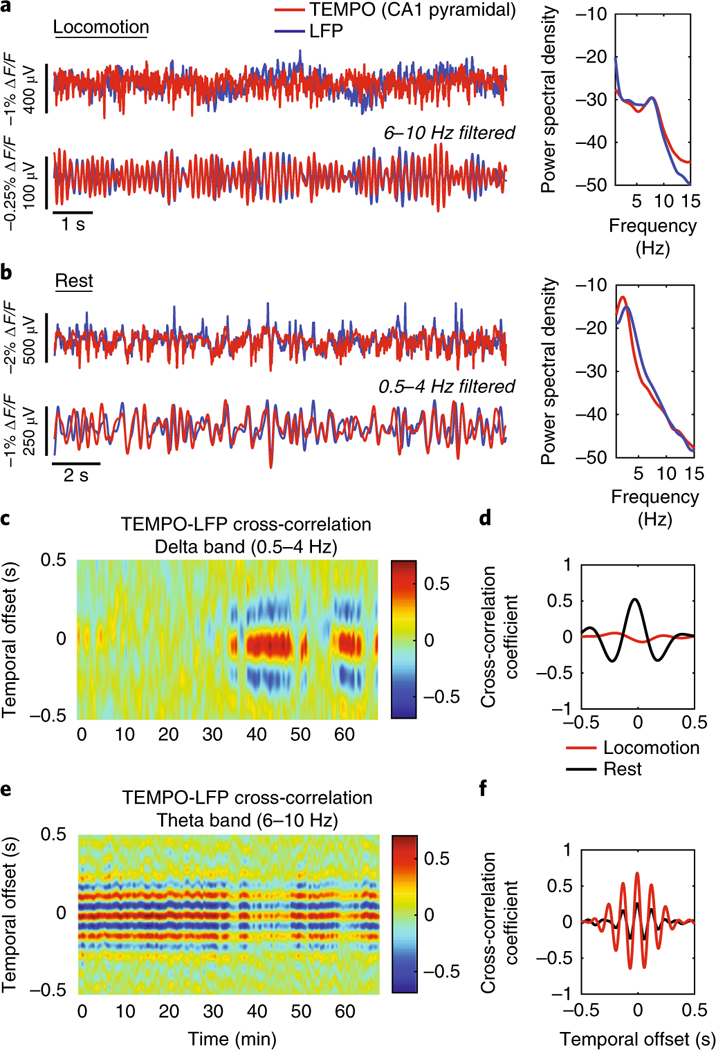
a,b, Left, time traces of TEMPO and LFP during locomotion (a) and rest (b). Traces show closely matched oscillations in both states. Right, normalized power spectral density. Note the prominent theta rhythm (6–10 Hz) during locomotion and delta rhythm (0.5–4 Hz) at rest. c−f, Cross-correlation plots between TEMPO and LFP filtered in the delta band (c) and theta band (e). Two-state behavior is seen with high coherence in the theta band during locomotion (beginning of recording) and delta band at rest (end of recording). d,f, Quantification of the average cross-correlation coefficient in the delta and theta bands, respectively, during locomotion and rest, showing opposite frequency band content.