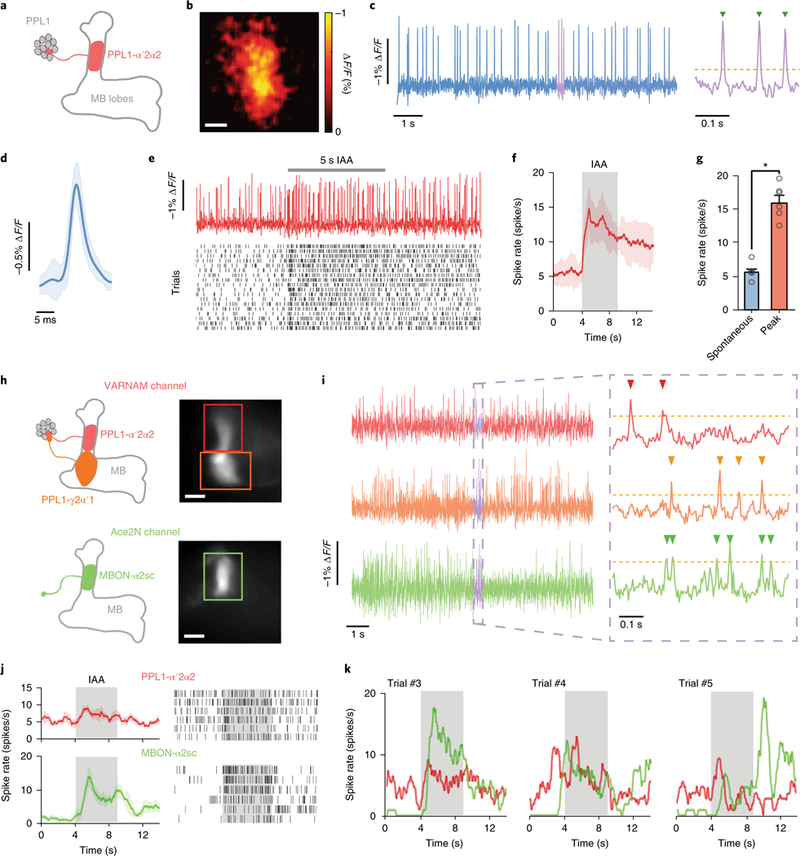
Fig. 6. odor-evoked and dual-color voltage imaging in live flies.

a, Cartoon of PPL1-α′2α2 projection (red) in a MB058B-GAL4>20×UAS-VARNAM fly. The axonal region in the mushroom body (MB) α′2α2 compartment was imaged. b, Spatial map of ΔF/F in the PPL1-α′2α2 axon (n = 6 flies). Scale bar: 10 μm. c, Optical recordings of spontaneous spiking over 10 s (left) and a 0.3 s interval shown at an expanded time scale (right). Yellow dashes indicate spike detection threshold. Green arrowheads denote identified spikes. d, Mean optical waveform of spontaneous spikes (blue trace) in c (n = 188 spikes). Light blue shading denotes s.d. e, Top, example trace of evoked spiking during 5 s presentation of isoamyl-acetate (IAA). Bottom, Raster plots of 18 trials of odor-evoked spiking (n = 6 flies). f, Time-varying mean spike rates in e before and during odor presentation. Red shading denotes s.d. g, Mean spike rates before and during odor presentation (P = 0.03, Wilcoxon two-sided signed-rank test). Error bars represent s.e.m. h, Cartoon depicting projections of PPL1-α′2α2 (red) and PPL1-γ 2α′1 (orange) in the VARNAM channel (upper left) and those of MBON-α2sc neuron (green) in the Ace-mNeon channel (lower left) in the dual-expression line. Right, epifluorescence images in the two channels showing regions-of-interest (boxed), comprising the axonal region of PPL1-α′2α2 (red), PPL1-γ2α′ 1 (orange) and the dendrite of MBON-α2sc (green) (n = 2 flies). Scale bar: 10 μm. i, Simultaneous dual-color recordings of spontaneous spiking in the three neurons over 10 s (left) and a 0.3 s interval shown at expanded time scale (right). Yellow dashes indicate spike detection threshold. Arrowheads denote identified spikes. j, Left, mean spike rates of PPL1-α′2α2 and MBON-α2sc neurons during 5 s IAA presentation. Shading denotes s.e.m. Right, raster plots of 6 trials of odor-evoked spiking from the neurons. k, Time-varying single-trial spike rates in PPL1-α′2α2 and MBON-α2sc neurons in three consecutive trials in j.
