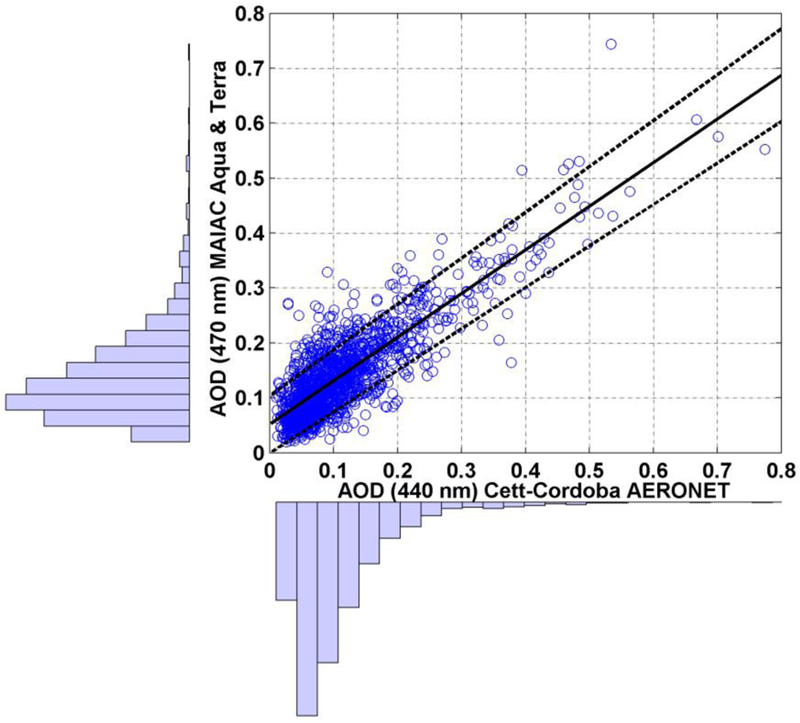
Figure 4.

Scatter plot of MAIAC AOD (0.47 μm) retrievals (25 × 25 km2 area, Aqua & Terra combined) vs Córdoba-CETT AERONET AOD at 0.44 μm (within ±60 min from the satellite overpass) over the period 2003–2010. The continuous black line corresponds to the data linear fit (y= a x + b, see Table 1) while dashed lines to the AOD Expected Error [EE = ± (0.05 + 0.05 × AOD)]. Histograms on each axis show the relative frequency distribution of the data within different AOD bins.
