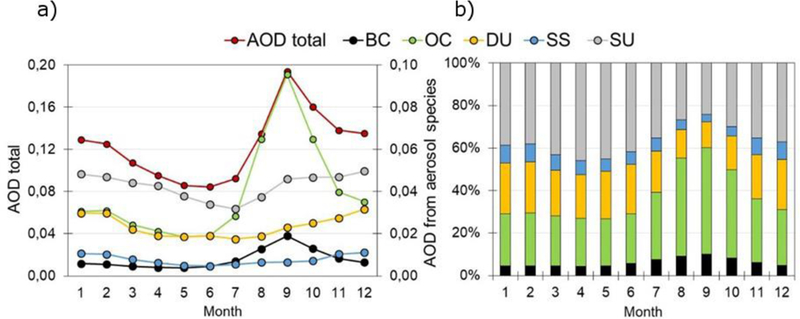
Figure 9.

a) Monthly median (2003–2015) total (red) and component-resolved (Black Carbon, BC, Organic Carbon, OC, Dust, DU, Sea Salt, SS and Sulfate, SU, see color legend) AOD at 0.550 μm as reproduced by the MERRA model over the Córdoba region. Note the different scale for the total AOD (left Y-axis) and the component-resolved ones (right Y-axis). b) Monthly-resolved relative contribution (%) of the different aerosol species to the total AOD.
