Figure 11.

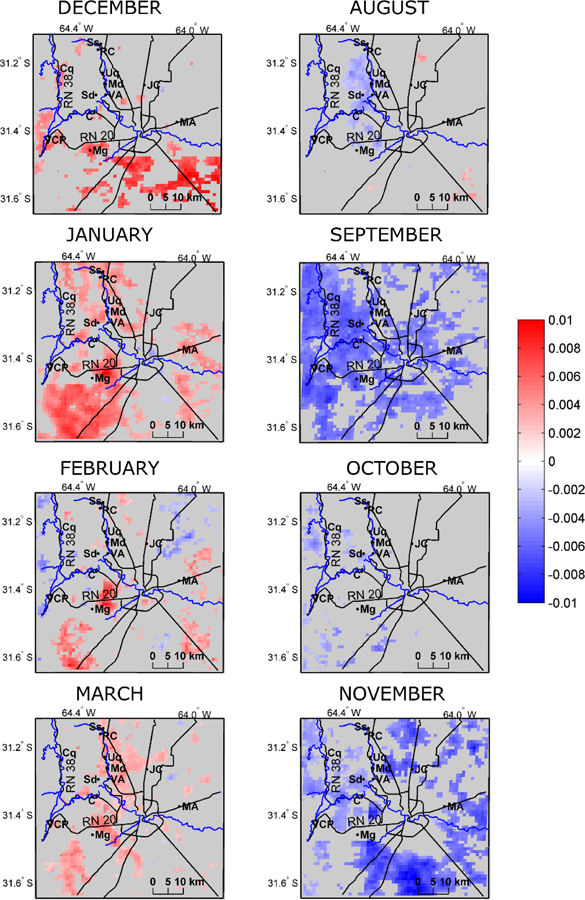
Monthly and 1km-resolved maps of the slope of the AOD linear fit (units/year) over the 13-year period 2003–2015. Gray areas are those in which the trend is not significant, p < 0.05.

Monthly and 1km-resolved maps of the slope of the AOD linear fit (units/year) over the 13-year period 2003–2015. Gray areas are those in which the trend is not significant, p < 0.05.