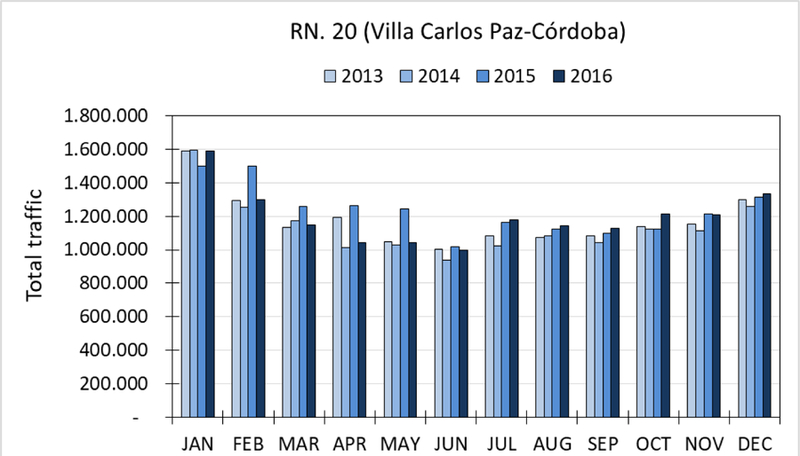
Figure A5.

Total vehicle transit recorded at the toll stations in National route 20 (see Figure 1b) during the 24 hours of the day in both directions of circulation (Source: National Directorate of Roads of Argentina, data available for the years 2013, 2014, 2015, 2016)
