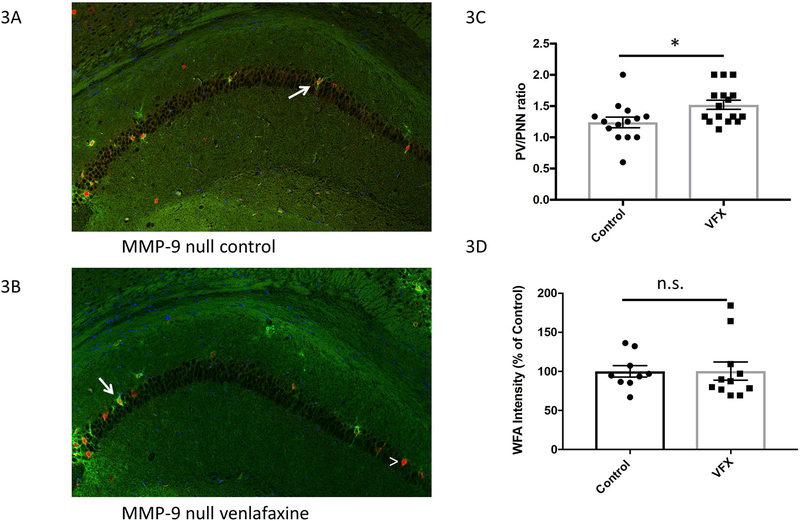
III. Venlafaxine stimulated changes in PNN integrity are reduced in MMP-9 null mice.
3A-B) PNN and PV staining in slice subsections from treated and untreated MMP-9 null mice. Representative PNN enwrapped PV cells are indicated by arrows, while a PV cell without an appreciable PNN is noted by the arrowhead. Scale bar represents 75μM. 3C) PV/PNN ratio for both groups, with data from wild type mice shown for comparison. For this analysis, n= 4–6 animals per group with 1–3 slides analyzed per animal. As in wild type animals, the number of PV positive cells was not affected by venlafaxine (control 6.87 +/− 0.79, N=14; venlafaxine 5.75 +/− 0.59, N=16; p= 0.26). Though reduced in magnitude as compared to wild type animals, the PV/PNN ratio was increased in the venlafaxine group (*Student’s t test p= 0.017). 3D) WFA intensity in control and venlafaxine treated MMP-9 null mice. Though the PV/PNN ratio was affected by venlafaxine in the MMP-9 nulls, in contrast to what was observed with wild type animals, the intensity of WFA flourescence was not reduced.

