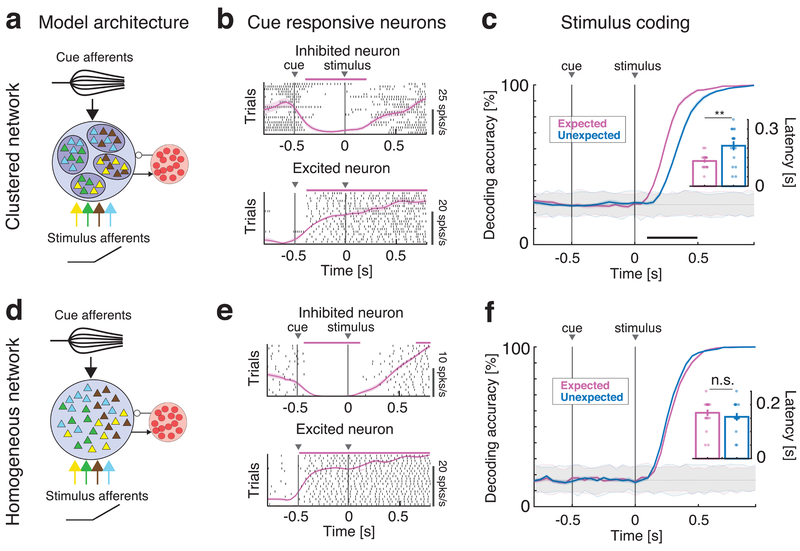
Fig. 1: Anticipatory activity requires a clustered network architecture.
Effects of anticipatory cue on stimulus coding in the clustered (a-c) and homogeneous (d-f) network. a: Schematics of the clustered network architecture and stimulation paradigm. A recurrent network of inhibitory (red circles) and excitatory neurons (triangles) arranged in clusters (ellipsoids) with stronger intra-cluster recurrent connectivity. The network receives bottom-up sensory stimuli targeting random, overlapping subsets of clusters (selectivity to 4 stimuli is color-coded), and one top-down anticipatory cue inducing a spatial variance in the cue afferent currents to excitatory neurons. b: Representative single neuron responses to cue and one stimulus in expected trials in the clustered network of a). Black tick marks represent spike times (rasters), with PSTH (mean±s.e.m.) overlaid in pink. Activity marked by horizontal bars was significantly different from baseline (pre-cue activity) and could either be excited (top panel) or inhibited (bottom) by the cue. c: Time course of cross-validated stimulus-decoding accuracy in the clustered network. Decoding accuracy increases faster during expected (pink) than unexpected (blue) trials in clustered networks (curves and color-shaded areas represent mean±s.e.m. across four tastes in n=20 simulated networks; color-dotted lines around gray shaded areas represent 95% C.I. from shuffled datasets). A separate classifier was used for each time bin, and decoding accuracy was assessed via a cross-validation procedure, yielding a confusion matrix whose diagonal represents the accuracy of classification for each of four tastes in that time bin (see text and Fig. S3 for details). Inset: aggregate analysis across n=20 simulated networks of the onset times of significant decoding (mean±s.e.m.) in expected (pink) vs. unexpected trials (blue) shows significantly faster onsets in the expected condition (two-sided t-test, p=0.0017). d: Schematics of the homogenous network architecture. Sensory stimuli modeled as in a). e: Representative single neuron responses to cue and one stimulus in expected trials in the homogeneous network of d), same conventions as in b). f: Cross-validated decoding accuracy in the homogeneous network (same analysis as in c). The latency of significant decoding in expected vs. unexpected trials is not significantly different. Inset: aggregate analysis of onset times of significant decoding (same as inset of c; two-sided t-test, p=0.31). Panels b, c, e, f: pink and black horizontal bars, p < 0.05, two-sided t-test with multiple-bin Bonferroni correction. Panel c: ** = p < 0.01, two-sided t-test. Panel f: n.s.: non-significant.

