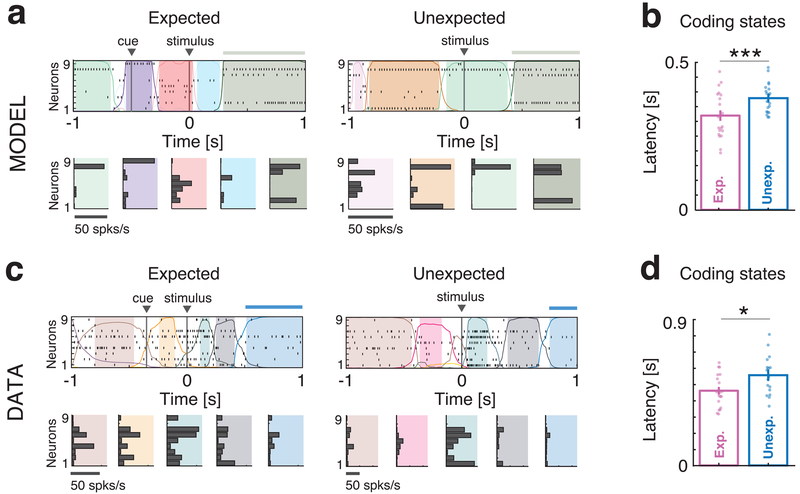
Fig. 5: Anticipation of coding states: model vs. data.
a: Representative trials from one ensemble of 9 simultaneously recorded neurons from clustered network simulations during expected (left) and unexpected (right) conditions. Top panels: spike rasters with latent states extracted via a HMM analysis (colored curves represent time course of state probabilities; colored areas indicate intervals where the probability of a state exceeds 80%; thick horizontal bars atop the rasters mark the presence of a stimulus-coding state). Bottom panels: Firing rate vectors for each latent state shown in the corresponding top panel. b: Latency of stimulus-coding states in expected (pink) vs. unexpected (blue) trials (mean±s.e.m. across n=20 simulated networks, two-sided t-test, p=0.014). Faster coding latency during expected trials is observed compared to unexpected trials. c-d: Same as a)-b) for the empirical datasets (mean±s.e.m. across n=17 recorded sessions, two-sided t-test, p=0.026). * = p < 0.05, ***= p < 0.001, two-sided t-test.

