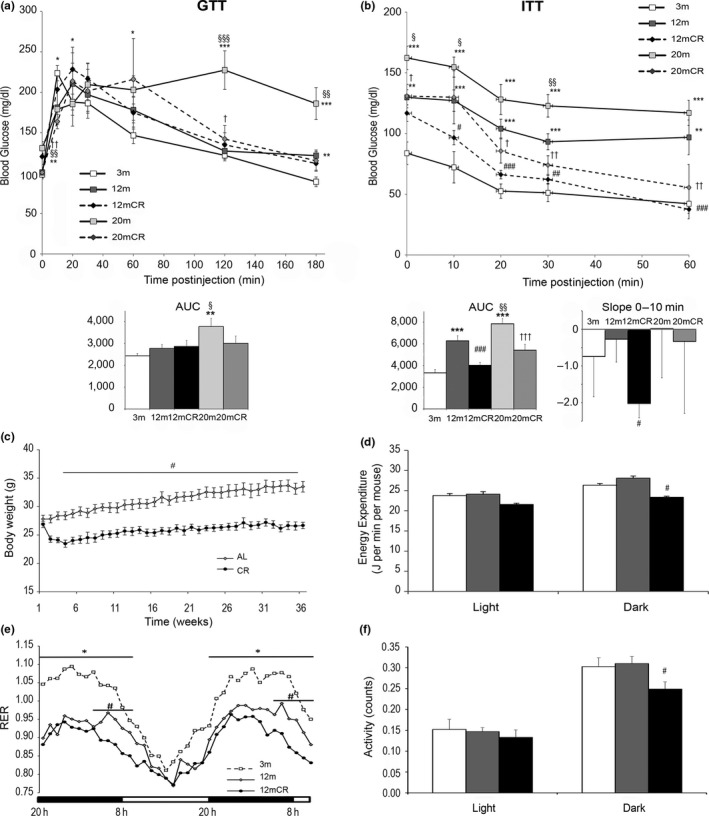
Figure 1.

Effect of aging and caloric restriction on body weight, energy expenditure, and insulin sensitivity. (a) GTT and (b) ITT curves with their respective AUC from 3‐m, 12‐m, 12mCR, 20‐m, and 20mCR mice. Slopes from 0 to 10 m in ITT are also represented in (b). (c) Evolution of body weight in 12‐month‐old mice fed ad libitum (12 m) or 20% CR (12mCR). (d–f) Indirect calorimetry was measured every hour: (d) energy expenditure (J/min/mouse), (e) respiratory exchange ratio (RER), and (e) locomotor activity (counts). Data are expressed as mean ± SEM (a, b: n = 7–9 animals/group; c: n = 11–24 animals/group; d–f: n = 3–9 animals/group). * p < 0.05, ** p < 0.01, *** p < 0.01 12 m or 20 m vs. 3 m; § p < 0.05, §§ p < 0.01, §§§ p < 0.001 20 m vs. 12 m; # p < 0.05, ## p < 0.01, ### p < 0.001 12mCR vs. 12 m; † p < 0.05 20mCR vs. 20 m
