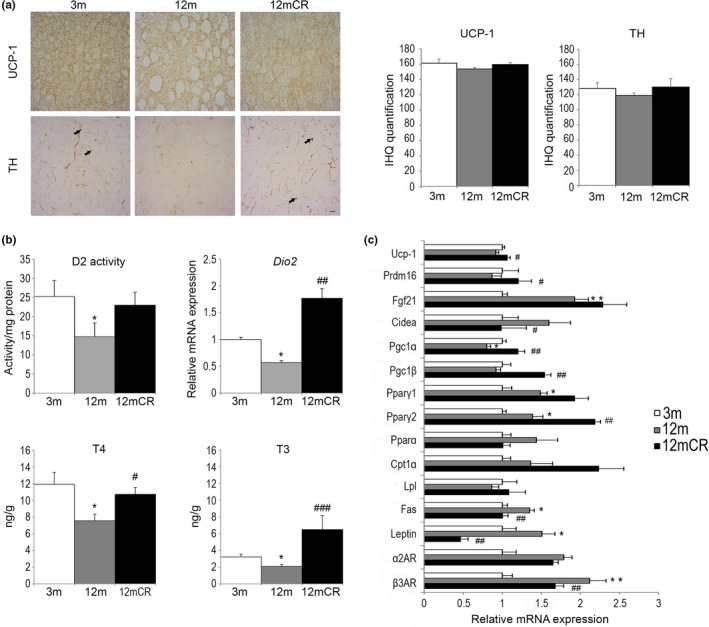
Figure 4.

Altered BAT architecture and thyroid‐regulated energy balance are associated with initial stages of aging. (a) Representative images of immunohistochemistry for UCP‐1 and TH expression in paraffin‐embedded BAT from histological sections (magnification 40×, scale bar = 20μm) of the experimental groups (n = 4 animals/group). Microphotographs show changes in the size of lipid droplets in brown adipocytes within the three experimental groups; arrowheads = TH‐positive parenchymal nerve fibers in 3‐m and 12mCR mice. (b) mRNA levels of BAT activity markers in the brown fat depot in all experimental groups. (c) D2 enzymatic activity, the expression levels of Dio2, and T4 and T3 concentration levels in brown fat depots in the experimental groups. All data are expressed as mean ± SEM (a, c: n = 7–9 animals/group). * p < 0.05, 12 m vs. 3 m; # p < 0.05, ## p < 0.01, ### p < 0.001, 12mCR vs. 12 m
