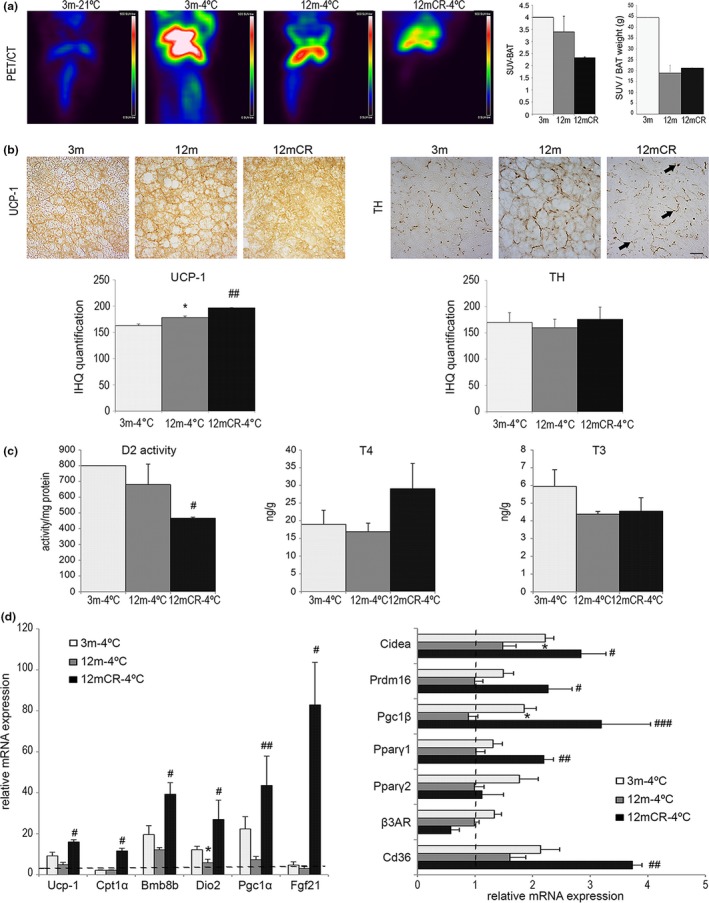
Figure 5.

Caloric restriction improves cold exposure response in aged mice. (a) Representative fused 18F‐FDG PET/CT images of the experimental groups at 21 and 4ºC. Three‐month‐old mice at room temperature were used as a control for the procedure. All images show glucose uptake in the BAT, quantified as standardized uptake values (SUVs). Scale bars for 18F‐FDG uptake (in color) are shown on the right of the images. Areas of high 18F‐FDG uptake are represented in red to white colors. Data are represented as mean ± SEM (n = 2–3 animals/group). (b) Representative images of immunohistochemistry of UCP‐1 and TH localization in paraffin‐embedded BAT from histological sections (magnification 40×, scale bar = 20μm) of the experimental groups (n = 4 animals/group). Arrows = TH‐positive parenchymal nerve fibers in exclusively brown adipocytes. (c) D2 enzymatic activity, T4 and T3 concentration levels, in brown fat depots in the experimental groups after cold exposure. (D) mRNA levels of BAT activity markers in the three experimental groups under cold exposure compared with 3‐m mice at room temperature (dotted line). All data are expressed as mean ± SEM (n = 7–9 animals/group). * p < 0.05, 12 m vs. 3 m; # p < 0.05, ## p < 0.01, 12mCR vs. 12 m
