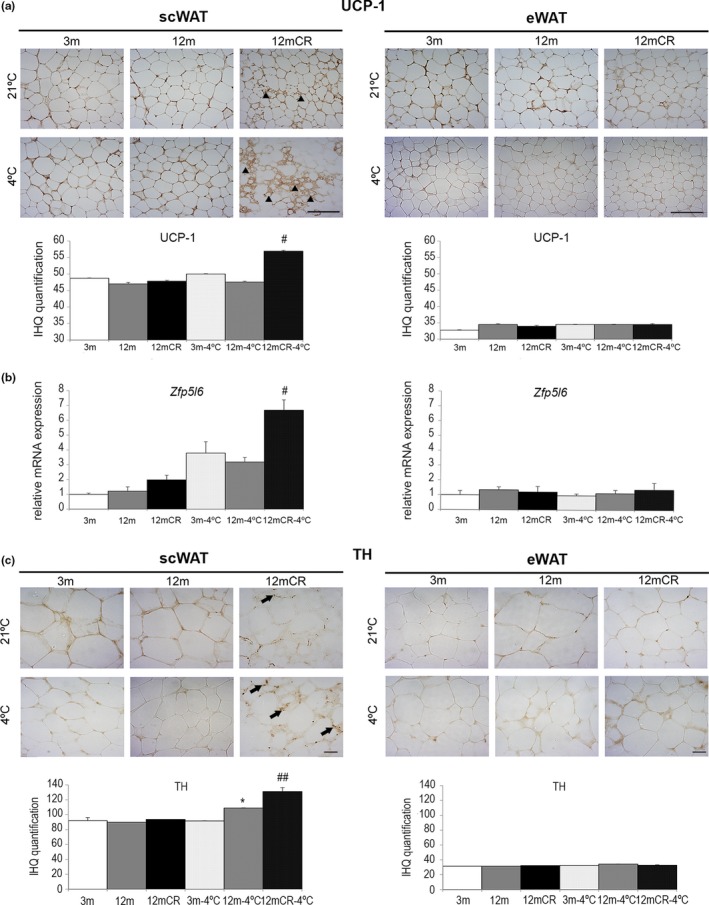
Figure 6.

Caloric restriction‐induced browning in scWAT at early stages of aging is more pronounced after cold exposure. (a) Representative images of immunohistochemistry of UCP‐1 expression in paraffin‐embedded histological sections of scWAT and eWAT (magnification 20×, scale bar = 50μm) of the experimental groups (n = 4 animals/group). Arrowheads indicate adipocytes with a brown‐like phenotype (adipocytes with multilocular lipid droplets) in 12mCR mice at room temperature. A stronger effect is detected after cold exposure. (b) mRNA levels of zfpl5 in scWAT and eWAT in all experimental groups. All data are expressed as mean ± SEM (n = 7–9 animals/group). # p < 0.05; 12mCR vs. 12 m. (c) Representative images of immunohistochemistry of TH expression in paraffin‐embedded histological sections of scWAT and eWAT (magnification 40×, scale bar = 20μm) of the experimental groups (n = 4 animals/group). Arrows = TH‐positive fibers in the parenchyma that are closely associated with adipocytes in areas containing large numbers of brown adipocytes
