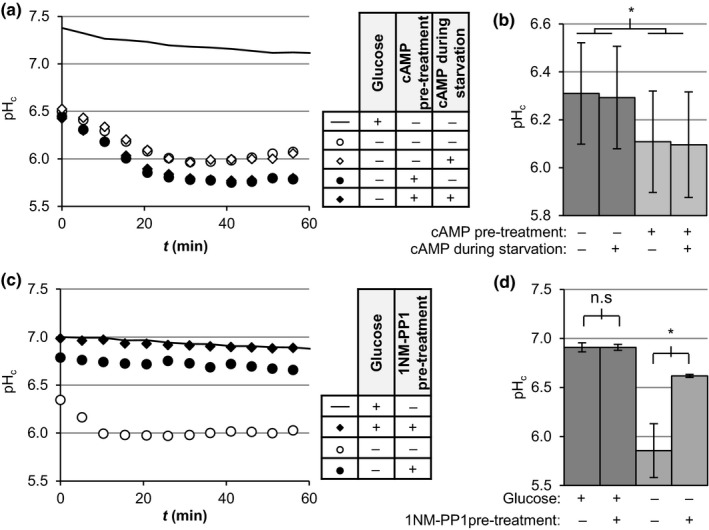
Figure 3.

Manipulation of PKA activity before glucose depletion modulates pHc upon glucose starvation. (a, c) Exponentially growing BY4741 (a) or TPK1astpk2∆tpk3∆ (c) cultures were subjected to the treatments indicated in the adjacent table and transferred to a microplate to monitor pHc as described in Materials and Methods. Data show a representative result. Pre‐treatments indicate incubation for 90 min prior to starvation with 20 mM cAMP (a) or 2 µM 1NM‐PP1 (c), while cAMP during starvation in (a) indicates the cells were washed with and starved in media without glucose containing 20 mM cAMP. (b, d) pHc 60 min after starvation for the indicated treatments as in (a) or (c), respectively. Data show averages ±SD of three biological replicates. Significance was tested using two‐way ANOVA with matching for both factors and Bonferroni's multiple comparisons test
