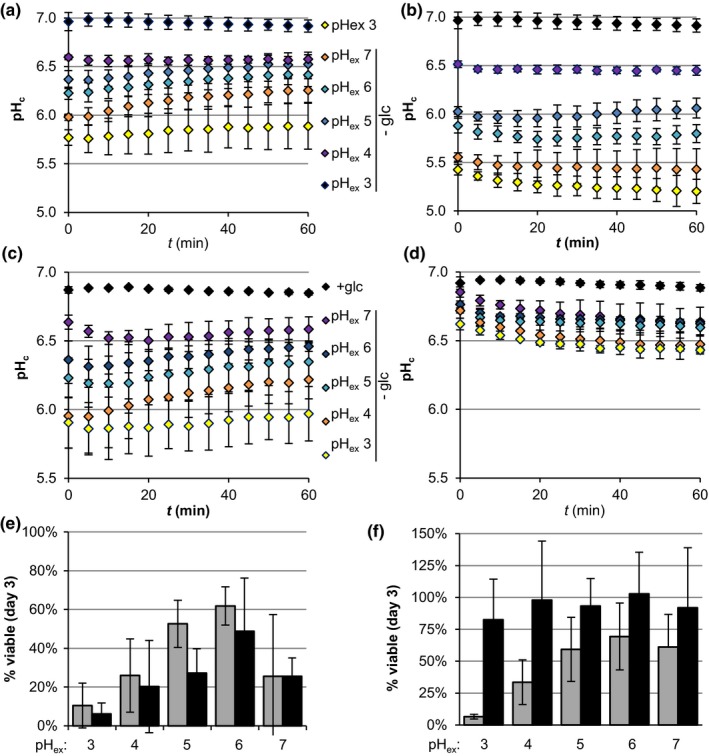
Figure 5.

Cytosolic acidification correlates with viability upon glucose starvation. (a, b) pHc dynamics of BY4741 cultures starved for glucose (glc) at different extracellular pH (pHex) in the absence (a; DMSO) or presence (b) of ebselen. (c, d) pHc dynamics of TPK1astpk2∆tpk3∆ cultures starved for glucose at different pHex after a control treatment with DMSO (c) or a treatment with 0.2 µM of 1NM‐PP1 (d) for 90 min prior to starvation. (e, f) Cell viability after three days of glucose starvation for (e) BY4741 cultures as in a and b or (f) for TPK1astpk2∆tpk3∆ cultures as in c and d. Grey bars represent control treatments. Black bars represent ebselen treatment (e) or 1NM‐PP1 pre‐treatment (f). Data shown are averages ±SD of three biological replicates
