
Figure 2.
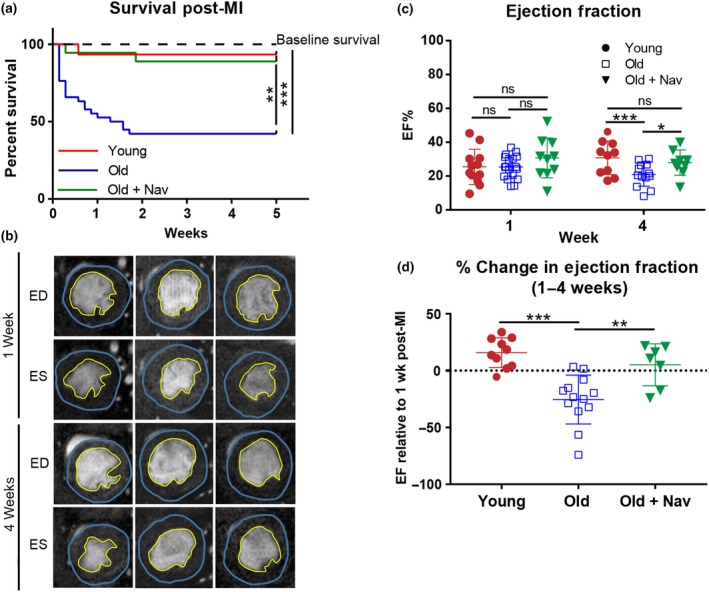
Navitoclax treatment improves survival and functional outcome following MI. (a) Kaplan–Meier survival curve following MI, n = 20–45 per group. Dotted line indicates survival between the age of 104–109 weeks in a cohort of vehicle‐treated mice that received no MI (n = 9). (b) Examples of individual short axis cine‐MR images post‐MI. ED = end diastole, ES = end systole. (c) Ejection fraction at 1 and 4 weeks post‐MI, n = 9–15 per group. (d) Relative change in ejection fraction between 1 and 4 weeks post‐MI, n = 7–11 per group. Data are mean ± SEM, ***p < 0.001; **p < 0.01; * p < 0.05 using one‐way ANOVA