
Figure 4.
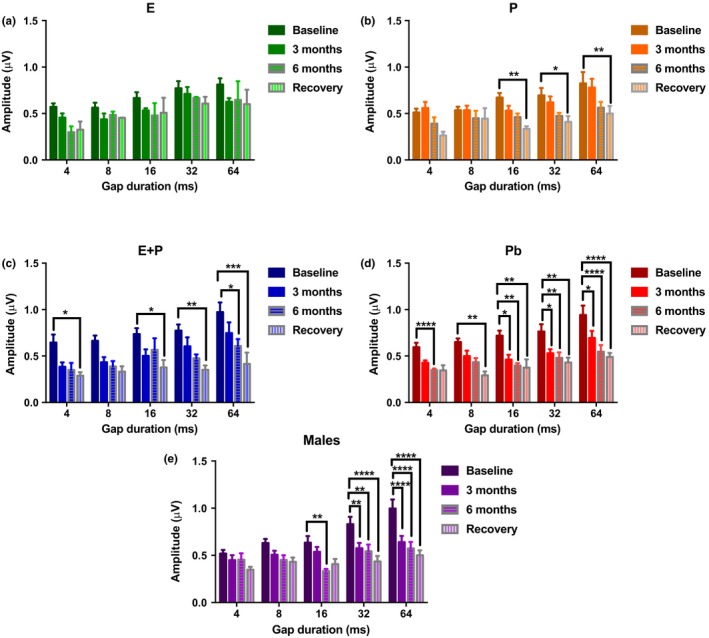
Auditory brainstem response gap‐in‐noise P4 amplitude levels for NB2 for subject groups during HRT and for the recovery period. (a) Amplitude levels for E‐treated animals decline marginally once treatment began. (b) The P group amplitude levels showed a steady decline throughout the advancement of treatment, with the largest differences seen during the recovery period. (c) E + P animals also displayed a significant decrease in P4 amplitude levels. Most striking differences were observed during the recovery period. (d) Amplitude values declined as early as 3 months for Pb animals. This group exhibited the worst reduction in amplitude levels among the female groups. (e) The males also showed signs of ARHL at longer gap intervals, starting at 16 ms. All of the groups, except E displayed changes during recovery, that is, for these groups P4 amplitudes worsened after HRT was discontinued. Statistical test: 2‐way ANOVA followed by Bonferroni; *p < 0.05, **p < 0.01, ***p < 0.001, ****p < 0.0001