
Figure 6.
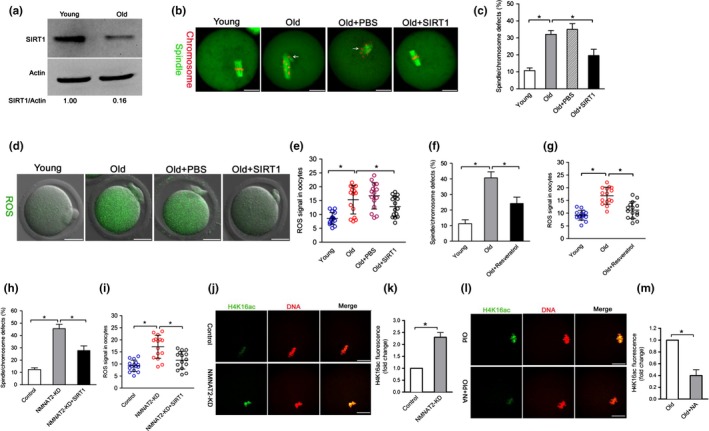
SIRT1 mediates the effects of NMNAT2 on quality control of aged oocytes. (a) Immunoblotting analysis shows the decrease SIRT1 expression in oocytes from old females compared to young controls. (b) Young, old, old + PBS, and old + SIRT1 oocytes were stained with α‐tubulin antibody to visualize spindle (green) and counterstained with PI to visualize chromosomes (red). Representative confocal sections are shown. Spindle/chromosome defects are indicated by arrows. (c) Quantification of young, old, old + PBS, and old + SIRT1 oocytes with spindle/chromosome defects (n = 120 for each group). (d) Representative images of CM‐H2DCFDA fluorescence (green) in young, old, old + PBS, and old + SIRT1 oocytes. (e) Quantification of the ROS signals in oocytes. Values are presented as individual dot plot, n = 15 for each group, biologically independent oocytes from at least two different mice. (f) Quantification of young, old, and old + resveratrol oocytes with spindle/chromosome defects (n = 120 for each group). (g) Quantification of the ROS signals in oocytes. Each data point represents an oocyte (n = 15 for each group). (h) Quantification of control, NMNAT2‐KD and NMNAT2‐KD + SIRT1 oocytes with spindle/chromosome defects (n = 120 for each group). (i) Quantification of the ROS signals in oocytes. Values are presented as individual dot plot, n = 15 for each group, biologically independent oocytes from at least two different mice. (j) Representative confocal images of acetylated‐H4K16 in control and NMNAT2‐KD oocytes. (k) Quantification of fluorescence intensity of acetylated H4K16 in control (n = 20) and NMNAT2‐KD (n = 18) oocytes. (l) Representative confocal images of acetylated‐H4K16 in old and old + NA oocytes. (m) Quantification of fluorescence intensity of acetylated H4K16 in old (n = 18) and old + NA (n = 22) oocytes. Error bars indicate ± SD. *p < 0.05 versus controls. Scale bars: 25 µm