
Figure 2.
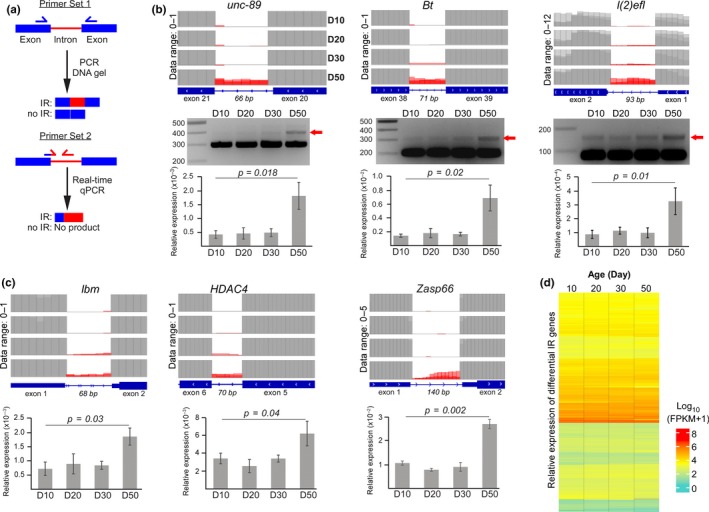
Experimental validation of IR at specific Drosophila genes. (a) Two different primer sets were designed to validate differential IR. (b, c) Top panel: The expression level of retained intron (red) and flanking exons (gray) on Integrative Genome Browser where the respective data range is indicated. Middle panel: Visualization of retained introns of three specific genes with DNA gel electrophoresis. Bottom panel: Real‐time quantitative PCR of differential retained introns using three biological replicates of fly heads for each time‐point (p < 0.05, paired t test). (d) Relative expression of differential IR genes across various age‐groups as represented by Log10 (FPKM + 1) values