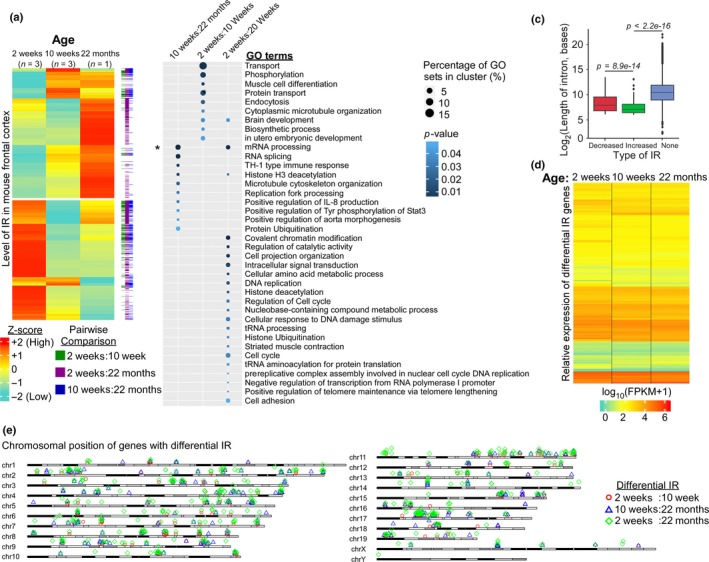
Figure 3.

Intron retentions across three age‐groups in mouse frontal cortex. (a) Expression heatmap of differentially retained introns across three age‐groups (2, 10 weeks, and 22 months) in mouse frontal cortex. (b) Gene ontology analysis of the differential IR genes determined through pairwise comparison between two distinct time‐points (p‐value <0.05, Fisher's exact test; *p‐value <0.05, Fisher's exact test with Benjamini–Hochberg correction). (c) Boxplot for the length distribution of the differentially retained and spliced introns. The expression level of intron at 2 weeks was used as the reference to determine the decreased or increased IR during aging. “None” refers to spliced introns (p‐value <0.05, Welch's t test). (d) Relative expression of IR genes between different ages of mouse frontal cortex as represented by Log10 (FPKM + 1) values. (e) Ideogram displaying the distribution of the differential IR genes across the mouse genome
