Figure 5.

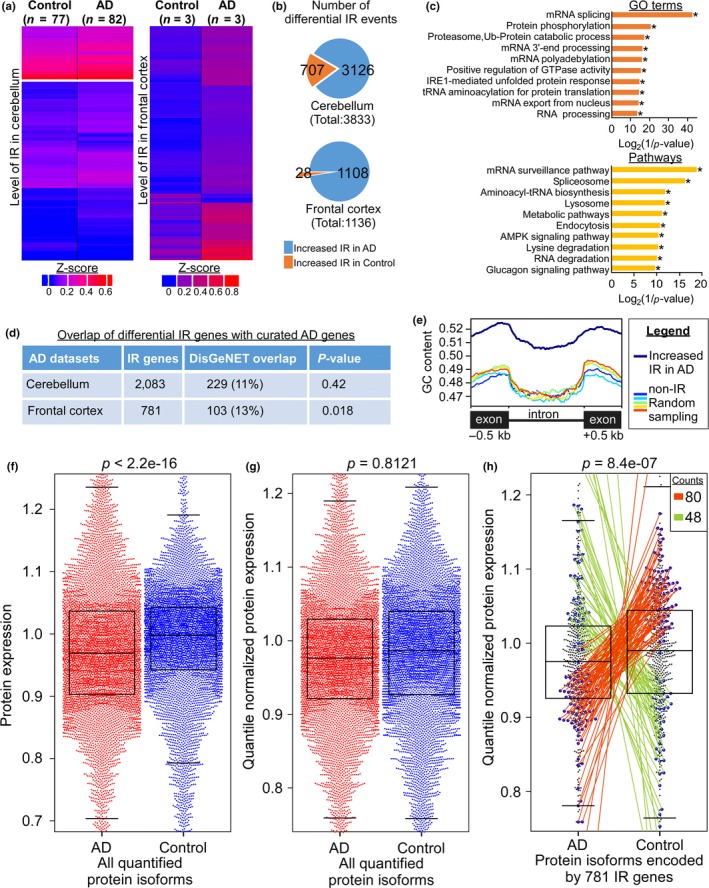
Increased number of IR events is observed in human AD brain tissues. (a) Expression heatmap of the differentially retained introns in the cerebellum (left, Mayo Clinic) and frontal cortex (right, University of Kentucky) from age‐matched control and AD subjects. (b) Pie diagrams indicating the number of increased IR events in cerebellum (top) and frontal cortex (bottom) of age‐matched control (orange) and AD patients (blue). (c) Gene ontology (*p‐value <0.05, Fisher's exact test with Benjamini–Hochberg correction) and pathway enrichment (*p‐value <0.05, hypergeometric test with FDR) analyses of the differential IR genes between control and AD cerebellum. (d) The overlap of differential IR genes identified in diseased brain tissues with curated AD genes from DisGeNET. The p‐value was determined by two‐tailed chi‐square test with Yates’ continuity correction. (e) GC content of the flanking exons and the differentially retained introns in AD frontal cortex. Five sets of non‐retained introns from genes with similar expression level were randomly picked as control. (f–g) Beeswarm boxplots illustrating the raw (f) and quantile normalized (g) expression of all 10,100 quantified protein isoforms in AD (red) and control (blue) frontal cortex. p‐value was calculated by Wilcoxon rank sum test with continuity correction. (h) The quantile normalized protein expression pattern of 781 differential IR genes is significantly different between AD and control frontal cortex (p‐value = 8.4e−07, Wilcoxon rank sum test with continuity correction). Blue dots represent genes whose protein level is significantly different between AD and control frontal cortex (p‐value <0.05, LIMMA t test). Among which, 73 (orange line) and 41 (green line) differential IR genes showed reduced and elevated protein level in AD frontal cortex, respectively
