
Figure 2.
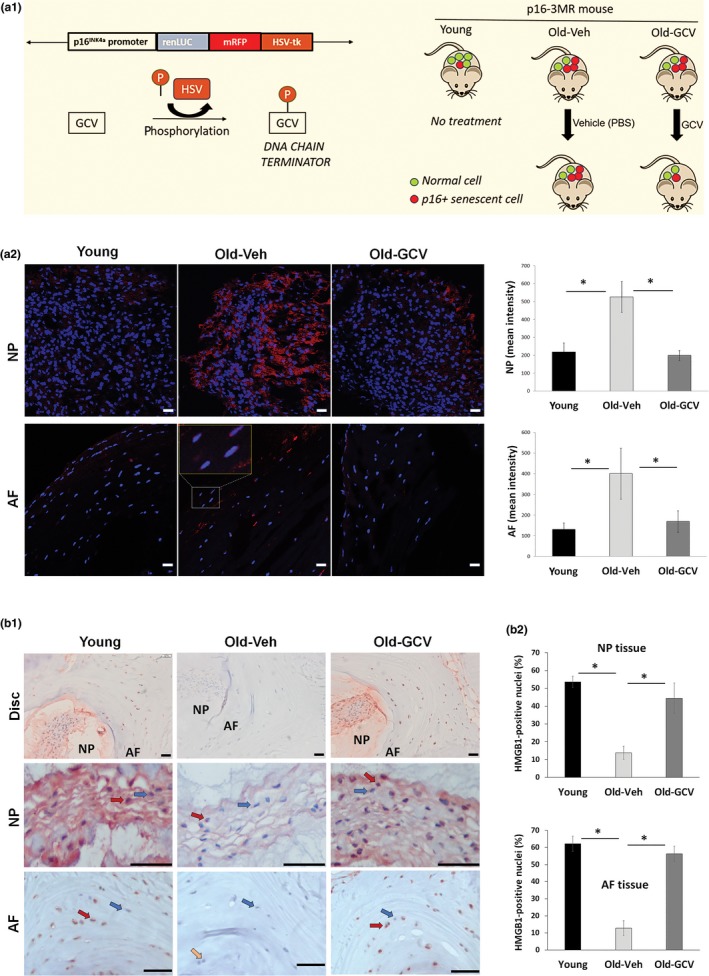
Clearance of senescent cells in p16‐3MR mice. (a1) Schematic of the p16‐3MR transgene and strategy used to selectively kill senescent cells. p16‐3MR mice were sacrificed at 12 months of age (Young) or were administered PBS (Old‐Veh) or GCV (Old‐GCV) for an additional 12 months before sacrifice. Confirmation of elimination of p16Ink4a‐positive cells in Old‐GCV mice was assessed by examining levels of RFP fluorescence (panel a2) and nuclear HMGB1 protein by IHC (panel b) in AF and NP tissues. Graphs on the right are quantification of the imaging results. Panel b2 shows quantitation of nuclear HMGB1 in disc cells. Data shown are means ± SEM of 4 independent experiments (4 mice), *p < 0.05. Examples of cells stained negative (blue arrows), partially positive (yellow arrow) or positive (red arrows) for nuclear HMGB1 are indicated. Scale bars = 10 µm (panel a2) and 50 µm (panel b1)