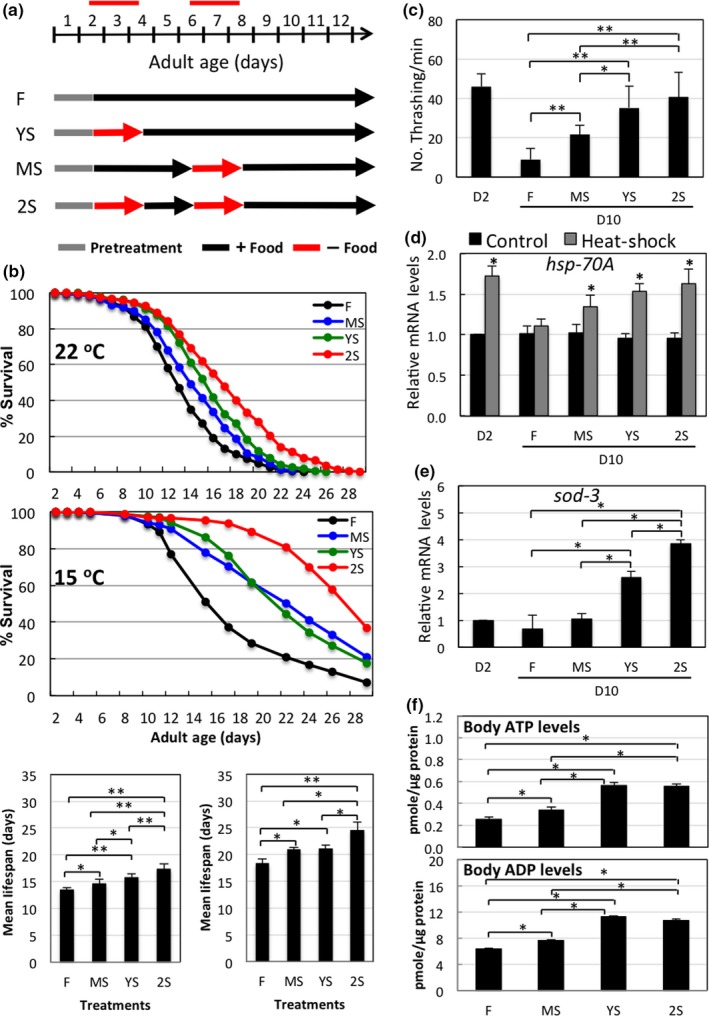
Figure 1.

Short‐term starvation (STS) stress preserves viability and vitality in adult male C. elegans during aging. (a) Schematic of STS treatments in adult male C. elegans maintained at 22°C. The first day of adulthood is denoted D1. Y: young‐age; M: mid‐age; S: starved. (b) Survival curves of N2 adult male worms maintained at either 15 or 22°C and that received various STS treatments as shown in Figure 1a. Data represent mean of n = 4 (15°C, middle panel) and n = 5 (22°C, upper panel), respectively. The survival curves for all the replicates are shown in Supporting Information Figure S1. For mean lifespan (bottom panel), data represent mean ± SD. Difference between two indicated groups: *, p < 0.05, **, p < 0.01. (c) Physical activity of STS stress‐treated adult male worms. D10 adult male worms subjected to various STS stress treatments as shown in Figure 1a were assayed for their thrashing activity. Data represent mean ± SD, n ≥ 10. Difference between two indicated groups: *, p ≤ 0.05; **, p ≤ 0.001. (d) qRT‐PCR analysis of hsp‐70A mRNA levels in D10 adult male worms subjected to various STS stress treatments as shown in Figure 1a and treated at 30°C for 3 hr to induce hsp‐70Aexpression. Data represent mean ± SD, n = 4. *Different from fed control (F) value of same group, p ≤ 0.001. (e) qRT‐PCR analysis of sod‐3 mRNA levels in D10 adult male worms subjected to various STS stress treatments as shown in Figure 1a. Data represent mean ± SD, n = 4. Difference between two indicated groups: *, p ≤ 0.001. (f) Body ATP levels of D10 adult male worms subjected to various STS stress treatments as shown in Figure 1a. Data represent mean ± SD, n = 3. Difference between two indicated groups: *, p ≤ 0.001
