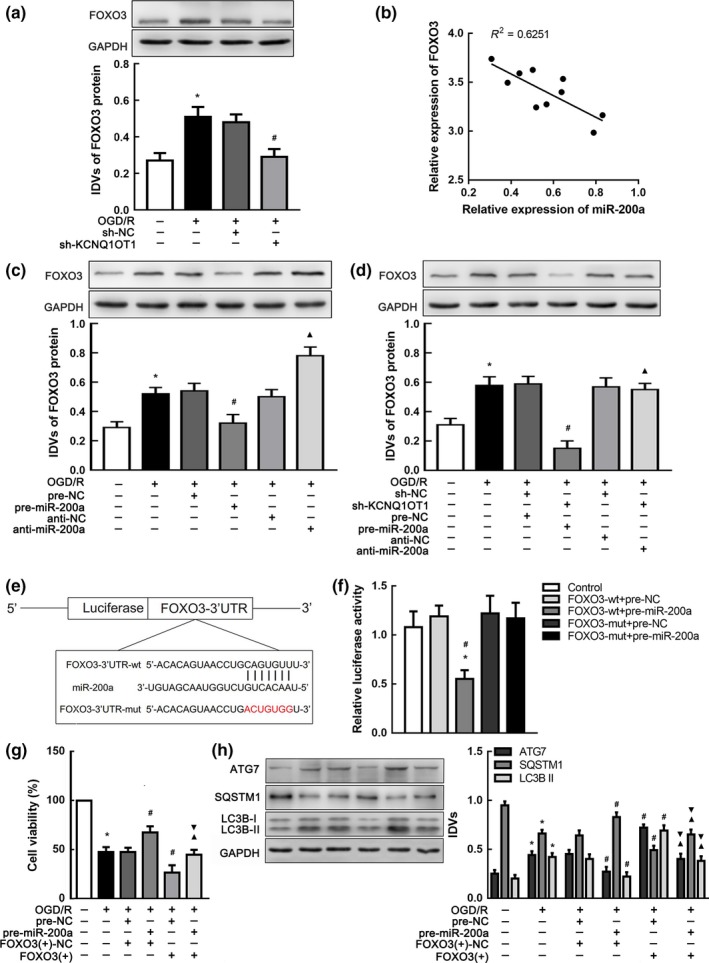
Figure 5.

FOXO3 was a target gene of miR‐200a and modulated by both KCNQ1OT1 and miR‐200a. (a) Western blot analysis of FOXO3 affected by KCNQ1OT1 knockdown in OGD/R. *p < 0.05 vs. control group. # p < 0.05 vs. OGD/R + sh‐NC group. (b) Linear regression analysis was conducted to each individual expression of miR‐200a and FOXO3 in tMCAO mice (n = 10). **p < 0.01. (c) Western blot analysis of FOXO3 expression affected by altered miR‐200a. *p < 0.05 vs. control group. # p < 0.05 vs. OGD/R + pre‐NC group. ▲ p < 0.05 vs. OGD/R + anti‐NC group. (d) Western blot analysis of FOXO3 expression affected by altered KCNQ1OT1 and miR‐200a with GAPDH as an endogenous control. *p < 0.05 vs. control group. # p < 0.05 vs. OGD/R + sh‐NC + pre‐NC group. (e) Presentation of the putative binding site of miR‐200a and FOXO3 (FOXO3‐wt), and the designed mutant sequence (FOXO3‐mut). (f)The relative luciferase activities of N2a cells co‐transfected FOXO3‐wt or FOXO3‐mut with pre‐miR‐200a or pre‐NC. *p < 0.05 vs. FOXO3‐wt + pre‐NC. # p < 0.05 vs. FOXO3‐mut + pre‐miR‐200a. (g) CCK‐8 assay was used to investigate the effect of altered miR‐200a and FOXO3 expression on OGD/R cells viability. (h) Western blot analysis of ATG7, SQSTM1, and LC3B II expression impacted by altered miR‐200a and FOXO3. *p < 0.05 vs. control group. # p < 0.05 vs. OGD/R + pre‐NC + FOXO3(+)‐NC group. ▲ p < 0.05 vs. OGD/R + pre‐miR‐200a + FOXO3(+)‐NC group. ▼ p < 0.05 vs. OGD/R + pre‐NC + FOXO3(+) group. For (a,c,d,f–h), data are presented as the mean ± SD (n = 3 in each group).
