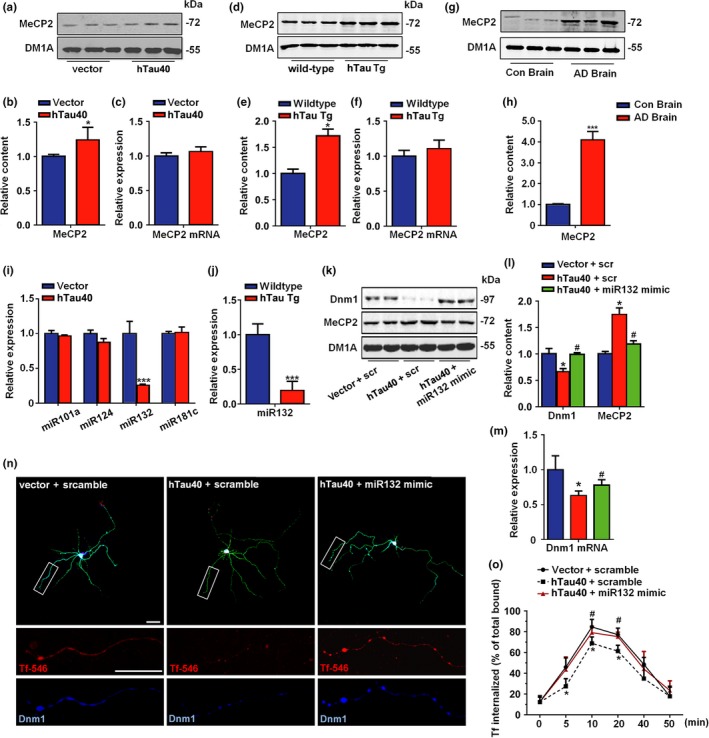
Figure 2.

MiR‐132/MeCP2 signal is involved in tau‐induced synaptic endocytosis deficits. (a) Neurons were infected with hTau virus or control, the representative blot of MeCP2 was shown and (b) the quantification. (c) mRNA level of MeCP2 in neurons treated above. N = 5. *p < 0.05, vs. vector. (d) The representative blots of MeCP2 in 12 weeks hTau transgenic mice cortex and their wild‐type and (e) the quantification. (f) The mRNA level of MeCP2 from above samples. N = 6. *p < 0.05, vs. wild‐type. (g) The representative blots of MeCP2 in AD brain samples and (h) the quantification. N = 5. ***p < 0.001, vs. con. (i) The levels of different microRNAs in hTau neurons. N = 5. ***p < 0.001, vs. vector. (j) The level of miR132 in the cortex of 12 weeks hTau transgenic mice and the wild‐type. N = 5. ***p < 0.001, vs. wild‐type. (k) The representative blots of dynamin1, MeCP2 in primary cortical neurons transfected with vector, hTau or hTau +miR132 mimics and (l) the quantification. N = 5. *p < 0.05, vs. vector. #p < 0.05, vs. hTau neurons. (m) The mRNA level of dynamin1 in the neurons treated as described in k. *p < 0.05, vs. vector. #p < 0.05, vs. hTau neurons. (n) Representative images or (o) timeline curve for the effects of miR‐132 on Tf‐546 endocytosis in hTau neurons. Bars = 50 μm. N = 5. *p < 0.05, vs. vector. #p < 0.05, vs. hTau neurons
