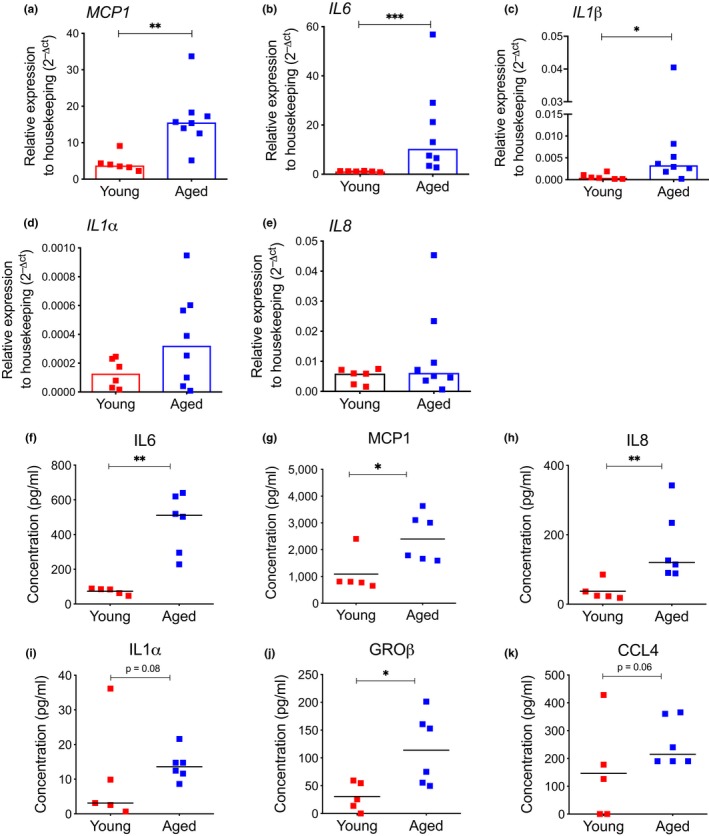
Figure 4.

Aged MSC display activation of SASP. (a–e) Gene expression analysis for MCP1, IL6, IL1β, IL1α, and IL8 by quantitative real‐time PCR in young and aged MSC. Gene expression data are represented as 2−△CT relative to GUSB housekeeping. Histograms indicate median 2−△CT values (young, n = 6; aged, n = 8); p‐value was determined by Mann–Whitney test; ***p < 0.001; **p < 0.01; *p < 0.05. (f–k) Levels of IL6, MCP1, IL8, IL1α, GRO‐β, and CCL4 measured by Luminex assay in conditioned medium (CM) collected from young and aged MSC at early passages in culture. Values are represented as scatter dot plot; lines indicate median values (young, n = 5; aged, n = 6). p‐value was determined by Mann–Whitney test; **p < 0.01; *p < 0.05
