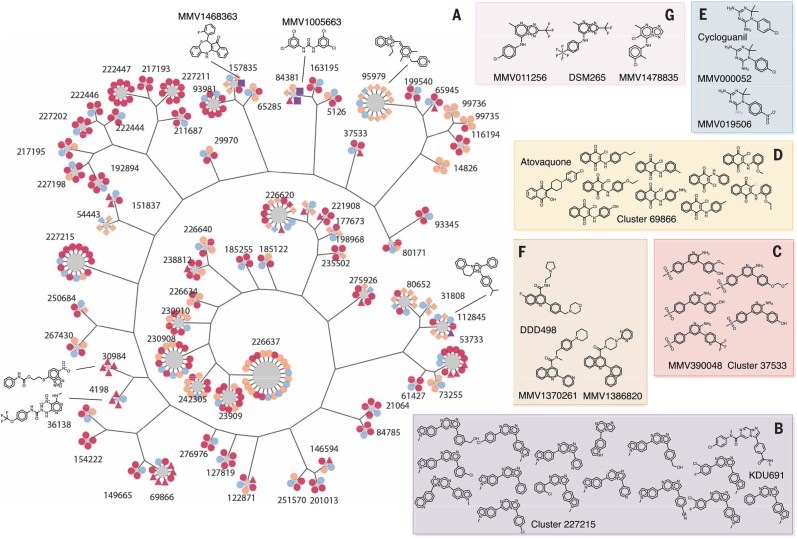
Fig. 2.
Cluster analysis. (A) For display, 405 compounds from 68 clusters that show a P value ≤ 0.05, cluster size ≥ 4, and hit fraction ≥ 0.75 are presented (data file S2). Most common substructure (MCS) per cluster is identified by using the top three active compounds, and a hierarchical tree was constructed from the MCSs to illustrate the intergroup connection. Compound members were then added to surround MCS nodes. All compound nodes are colored by hit status and shaped by other annotations. Primary hits are orange, reconfirmation hits (Pbluc IC50 < 10 µM) are red, third-round reconfirmation set (631 compounds) is purple, and others are light blue. P. falciparum asexual blood state–active compounds (ABS-Sybr IC50 < 10µM) are indicated by squares, luciferase inhibitors (Ffluc IC50 < Pbluc IC50 / 2) are indicated by triangles, hepatocyte toxic (primary HepG2tox > 50% or HepG2tox CC50 < Pbluc IC50 / 2) are indicated by diamonds, and the rest are shown as circles. (B to G) Active compounds in selected clusters [(B), (C), and (D)] with hit fractions of less than 0.75, as well as examples of singleton hits that are similar to the known antimalarial compounds, (E) cycloguanil, (F) DDD107498 (13), and (G) DSM265 (data file S3) (16).

