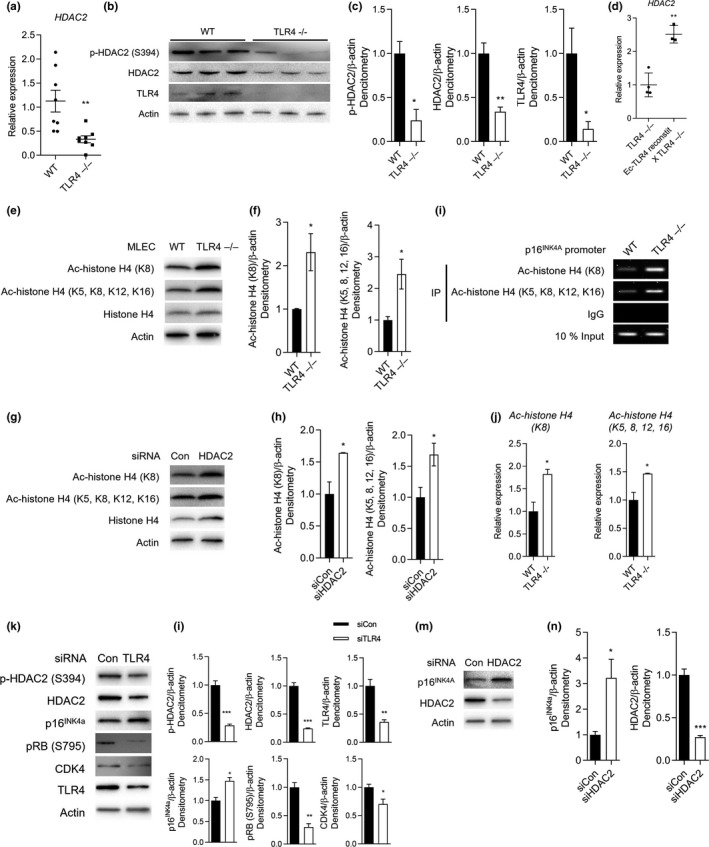
Figure 5.

Endothelial cell (Ec)‐TLR4 suppresses p16INK4a via histone deacetylase (HDAC)2 in mouse lung Ec (MLEC) and in lungs. (a) HDAC2 mRNA expression in WT and TLR4−/− MLEC. (n = 7 per group) **p < 0.01 vs. WT. (b) Phosphorylated (p)‐HDAC2 and HDAC2 protein expressions in lung homogenates of WT and TLR4−/− mice, and (c) their representative graphs. (n = 3 per group). *p < 0.05, **p < 0.01 vs. WT. (d) HDAC2 mRNA expression in lung homogenates of TLR4−/− and Ec‐TLR4‐reconstit X TLR4−/− mice. (e) Acetylated (Ac)‐histone H4 (K8 or K5, 8, 12, 16) and histone H4 protein expression in WT and TLR4−/− MLEC, and (f) their representative graphs (n = 3 per group). *p < 0.05 vs. WT. (g) Ac‐histone H4 (K8 or K5, 8, 12, 16) and histone H4 protein expression in HDAC2 siRNA (siHDAC2) in hLMVEC and (h) their representative graphs (n = 3 per group). *p < 0.05 vs. siCon. (i) Chromatin‐IP analysis for measuring relationship between p16INK4a and Ac‐histone H4. IgG was used as a negative control, whereas 10% input DNA was used as a positive control. (j) Graph represents Ac‐histone H4 (K8)/10% input and Ac‐histone H4 (K5, 8, 12, 16)/10% input intensity ratio (n = 3 per group). *p < 0.05 vs. WT. (k) p‐HDAC2, HDAC2, p16INK4a, pRB (S795), CDK4 and TLR4 protein expression in siCon or siTLR4‐treated hLMVEC and (l) their representative graphs (n = 3 per group). *p < 0.05, **p < 0.01, ***p < 0.001 vs. siCon. (m) p16INK4a and HDAC2 protein expression in siCon or siHDAC2‐treated hLMVEC and (n) their representative graphs (n = 3 per group). *p < 0.05, ***p < 0.001 vs. siCon
