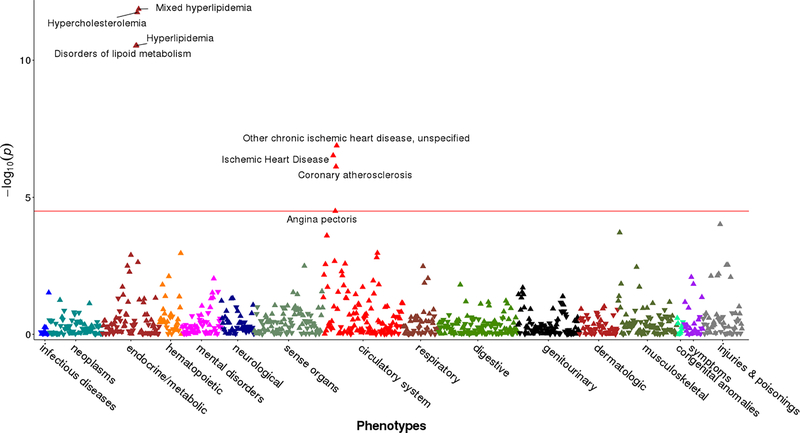
Figure 3.
The genetic associations between pathogenic FH variants and clinical outcomes in a phenome-wide association (PheWAS) analysis. Red horizontal line represents Bonferroni corrected p-value of 0.05. Positive association denoted by triangle pointing up (▲), and negative association by triangle pointing down (▼).

