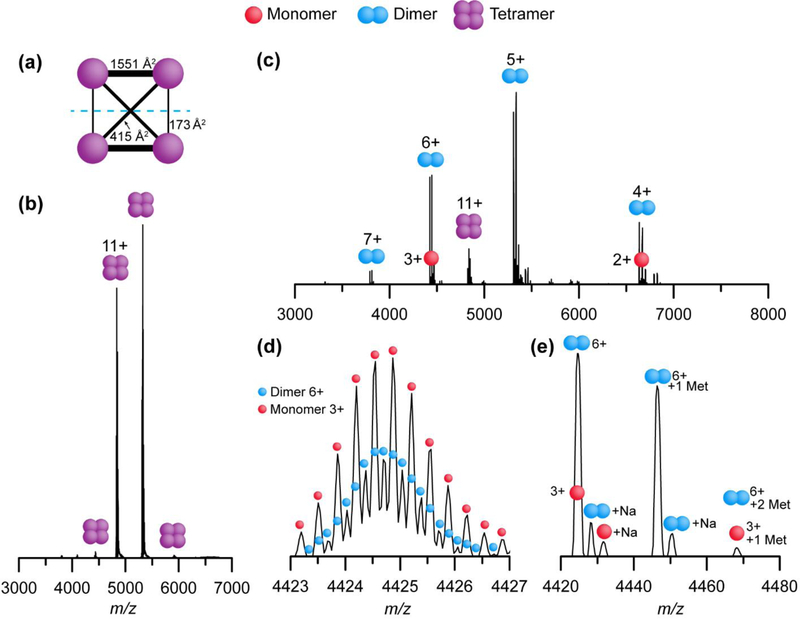
Figure 2.
(a) Interface areas of streptavidin tetramer as determined by PISA analysis (1SWB).58 (b) Mass spectrum of streptavidin tetramer under charge reducing conditions. (c) SID spectrum (45 V, 495 eV) of the 11+ tetramer. (d) A zoomed-in segment of (c) at 140,000 resolution setting, revealing the isotope distributions of 3+ monomer and 6+ homodimer. (e) A zoomed in segment of (c) at 17,500 resolution setting, showing non-cleaved N-terminal methionine(s) and sodium adducts on 3+ monomer and 6+ dimer.

