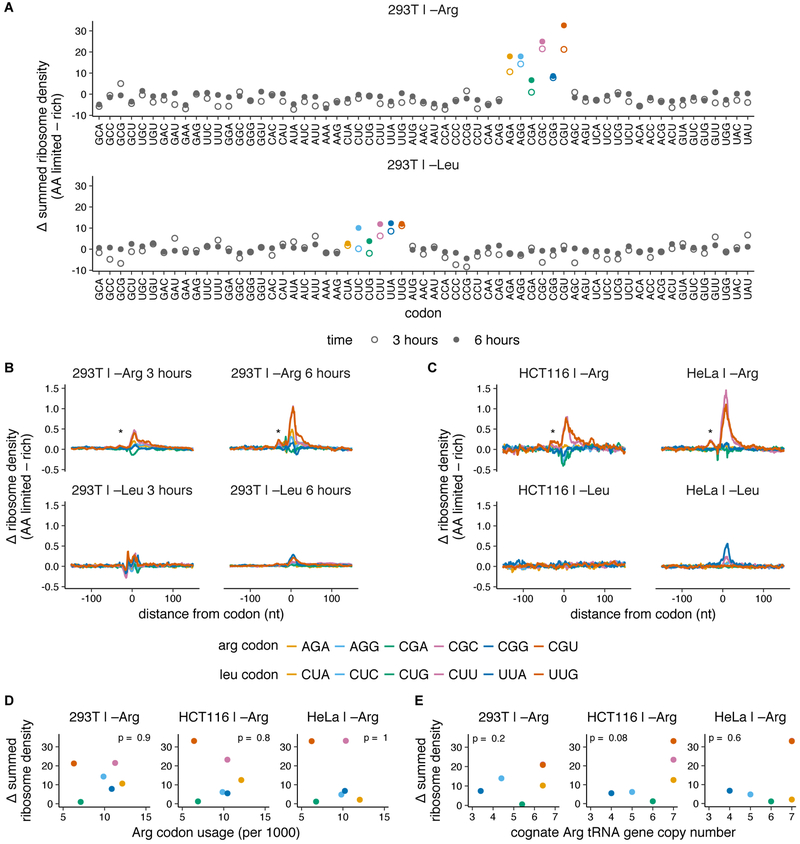
Fig. 1. Codon-specific ribosome pausing emerges during limitation for arginine, but not leucine.
(A-C) Changes in codon-specific ribosome density in HEK293T cells, HCT116, and HeLa cells upon 3 or 6 hours of leucine or arginine limitation. Ribosome density for each codon is calculated relative to the mean footprint density for each coding sequence, and is averaged over all occurrences of the codon across detectably expressed transcripts (see Methods for details). The difference in ribosome density between amino acid limited and rich conditions across a 150 nt window around each codon is summed (A) or shown as such (B,C) (* = trailing ribosome stalled behind the paused ribosome). Arg and Leu codons are colored according to legend in B,C (D-E) The summed change in ribosome density at arginine codons following 3 hours of arginine limitation in each cell line (see A, S1H) is compared to the transcriptome usage frequency of Arg codons (see Fig. S1J) (D) or genomic copy number of the cognate tRNA for each Arg codon (see Fig. S1K) (E). Arg and Leu codons are colored according to legend in B,C. p indicates p-value of Spearman’s rank coefficient, ρ and is shown at the top of each plot (in D: HEK293T, ρ = −0.1; HCT116, ρ = −0.14; HeLa, ρ = 0.03. In E: HEK293T, ρ = 0.58; HCT116, ρ = 0.76; HeLa, ρ = 0.27).

