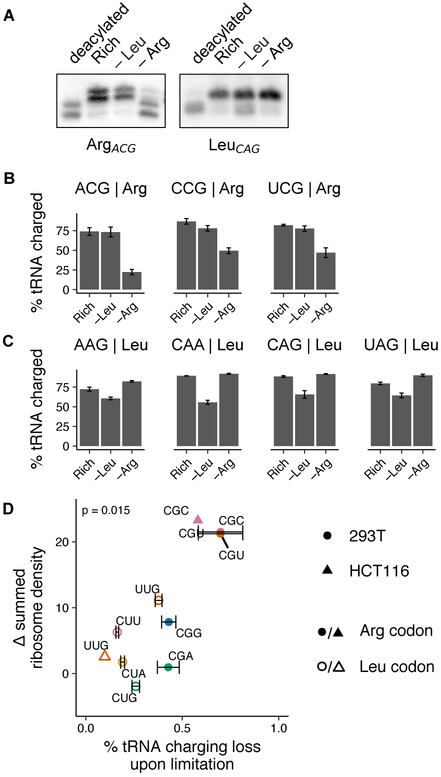
Fig. 2. Selective loss of cognate tRNA charging during arginine limitation.
(A) Representative northern blots for determination of Arg and Leu tRNA charging levels (as shown in B) in HEK293T cells following 3 hours of limitation for leucine or arginine or growth in rich medium. A control deacylated total RNA sample is used to identify uncharged tRNA species. tRNA probe is indicated below each blot (see Methods for details on interpretation, quantification, and probe design; see Fig. S2 for additional blots). (B-C) tRNA charging levels for 3 Arg (B) and 4 Leu tRNAs (C) in HEK293T cells following 3 hours of leucine or arginine limitation or growth in rich medium (calculated as described in Methods). tRNA anticodon and isotype are indicated above plots; error bars represent the standard error of the mean from three technical replicates (see A and Fig. S2 for additional representative blots and Fig. S1L for codon-tRNA pairs). (D) The summed change in ribosome density at arginine and leucine codons following 3 hours of leucine or arginine limitation in HEK293T and HCT116 cells (see Fig. 1A) is plotted against the loss in charging for the cognate tRNA (for those measured) in the same condition. p indicates p-value of Spearman’s rank coefficient, ρ and is shown at the top of the plot (ρ = 0.7).

