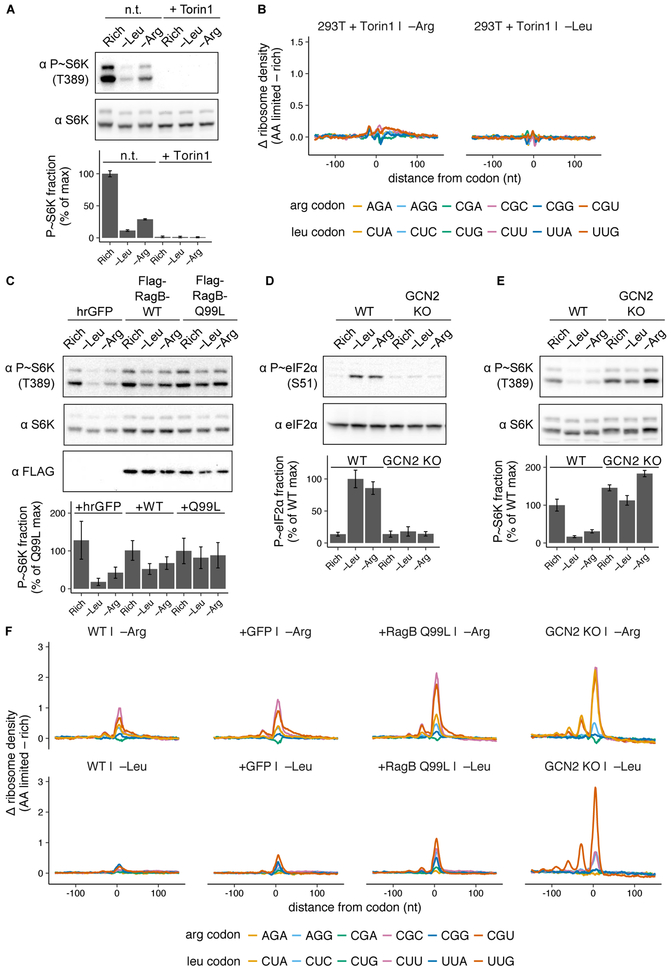
Fig. 4. Signaling through the mTORC1 and GCN2 pathways regulates the magnitude of ribosome pausing during amino acid limitation.
(A) Representative western blots for phosphorylated and total S6K in HEK293T cells after growth in rich medium or limitation for leucine or arginine for 3 hours, with or without (n.t.) 250 nM Torin1. Bar graph shows percent of protein that is phosphorylated, relative to the maximum; error bars represent the standard error of the mean from three technical replicates. (B) Changes in codon-specific ribosome density in the hrGFP cell line (as shown in C) after 3 hours of leucine or arginine limitation with 250 nM Torin1, relative to rich medium. (C) Representative western blots for phosphorylated S6K, total S6K, and FLAG after growth in rich medium, or 3 hours of leucine or arginine limitation in HEK293T cells stably expressing either hrGFP, FLAG-RagB-WT (RagB-WT), or FLAG-RagB-Q99L (RagB-Q99L). Bar graph shows percent of protein that is phosphorylated, relative to the maximum in the RagB-Q99L cell line; error bars represent the standard error of the mean from three technical replicates. (D,E) Representative western blots for phosphorylated and total eIF2α (D) or S6K (E) after growth in rich medium, or 3 hours of leucine or arginine limitation in the HEK293T (WT) or GCN2 KO cell lines. Bar graphs show percent of protein that is phosphorylated, relative to the maximum in WT cells; error bars represent the standard error of the mean from three technical replicates. (F) Changes in codon-specific ribosome density for WT, hrGFP, FLAG-RagB-Q99L, and GCN2 KO cell lines following 6 hours of limitation for leucine or arginine, relative to rich medium.

