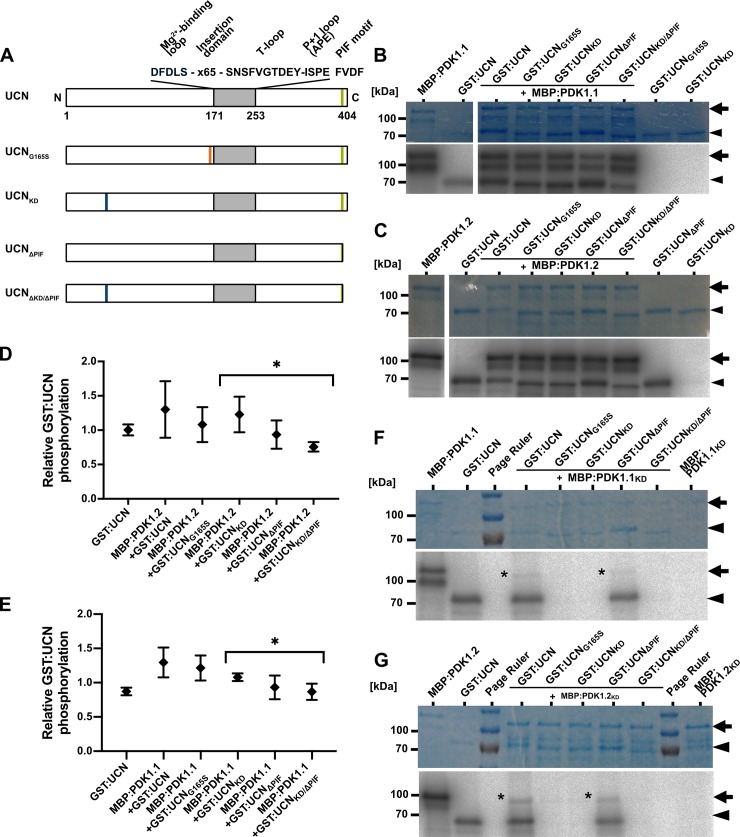
Fig 5. In vitro kinase assays with PDK1 in combination with different UCN variants.
(A) Cartoon outlining the domain structure of UCN and marking the alterations in the different mutant variants. The plant AGC protein kinase specific insertion domain in the activation segment is also indicated. (B,C) and (F,G) Shown are coomassie brilliant blue (CBB)-stained gels (upper panel) and autoradiograms (lower panel) for MBP:PDK1.1, MBP:PDK1.2, MBP:PDK1.1KD, and MBP:PDK1.2KD, respectively, in combination with different GST:UCN versions. Arrows indicate the various MBP:PDK1 forms, arrowheads mark the different GST:UCN variants. (B) Kinase assays involving MBP:PDK1.1. Note the presence of corresponding labelled bands for all variants of GST:UCN. (C) Kinase assays involving MBP:PDK1.2. Note the presence of corresponding labelled bands for all variants of GST:UCN. (F) Kinase assays involving MBP:PDK1.1KD. Asterisk indicates MBP:PDK1.1KD band weakly phosphorylated by GST:UCN or GST:UCNΔPIF. (G) Kinase assays involving MBP:PDK1.2KD. Asterisk indicates MBP:PDK1.2KD band weakly phosphorylated by GST:UCN or GST:UCNΔPIF. (D,E) Intensity-based quantification of the bands indicated by the arrowheads and arrows in (B,C and F,G) (autoradiogram signal relative to the corresponding CBB gel band intensity) using ImageJ/Fiji [80,81]. The results of three independent experiments (involving protein induction, purification and kinase assays) are shown. Please note statistically significant differences of phosphorylation intensity in a PIF motif-dependent manner (asterisks): (D) p = 0.031; (E) p = 0.039.

