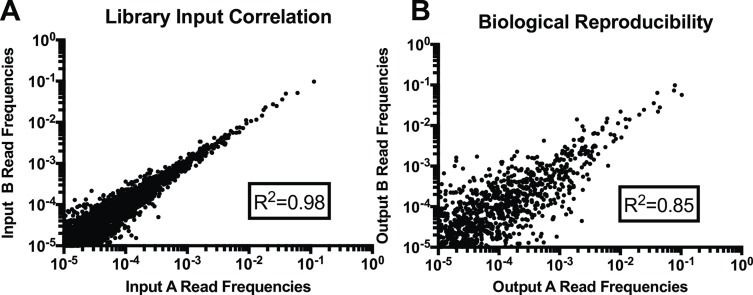
Fig 1. Correlation between replicates of the larval tick survival Tn-seq experiment.
(A) Correlation between the mutant compositions of the two replicate cultures of the input Tn library. (B) Correlation between the mutant compositions of the two replicate cultures of the Tn mutants recovered from the fed larvae (output library). Each data point represents the frequency of an individual Tn mutant in relation to the total input or output respectively. Each axis represents a different biological replicate.

