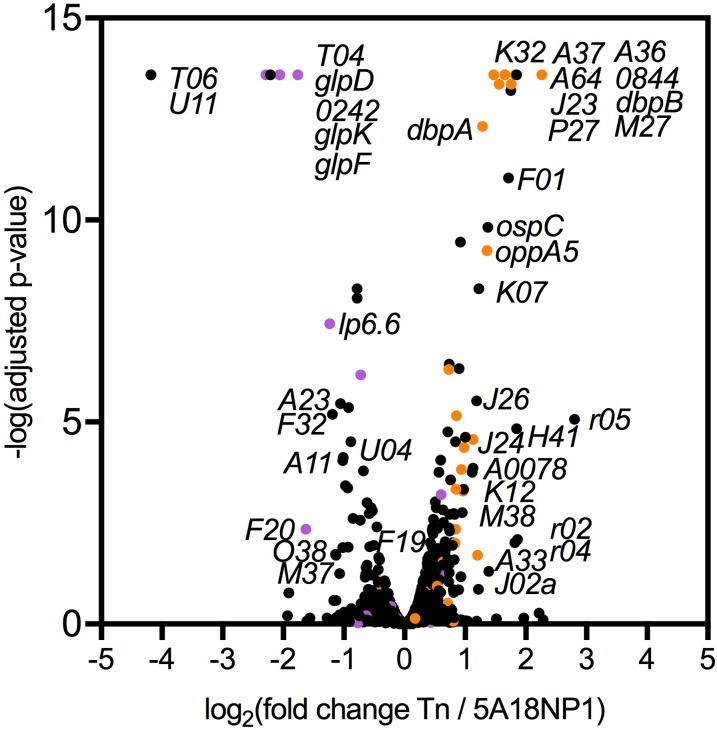
Fig 4. Genes differentially expressed in the Tn::bb0017 mutant compared to parental strain in RNA-seq experiment.
Volcano plot showing differential gene expression between the Tn::bb0017 mutant and the parental strain. Genes that were significantly different are labeled by name in the graph. Purple circles indicates that the gene is repressed by rpoS while orange circles indicates that a gene is activated by rpoS. The gene abbreviation system assigns a letter based on the plasmid location.

