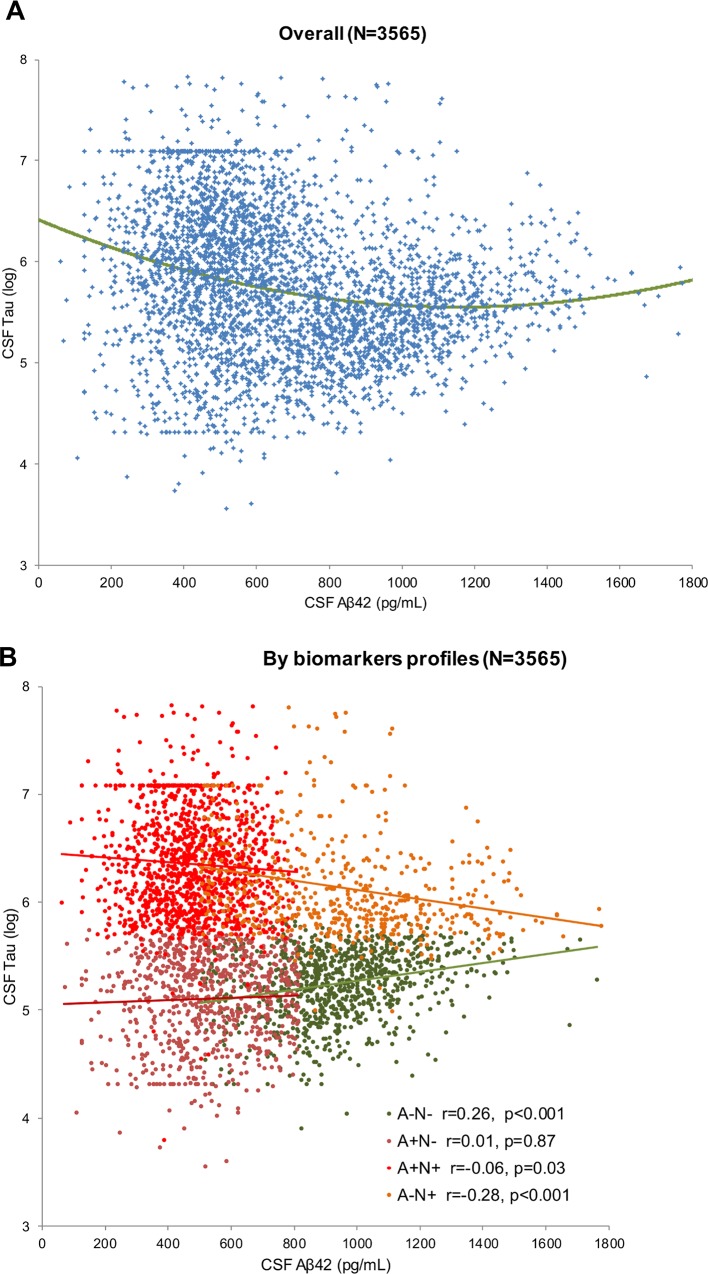
Fig 1. Scatter plot of CSF Aβ42 and log transformed CSF Tau.
A. In the total study population. The quadratic model is presented in green. B. In analysis separately in each profile. Green: A-N-, brown: A+N-, orange: A-N+, red: A+N+. Linear regression models are presented and Spearman correlation coefficients.

